
Answer to Map #28
Click here for a full-size version of this week’s map.
Back to this week’s map and hints.
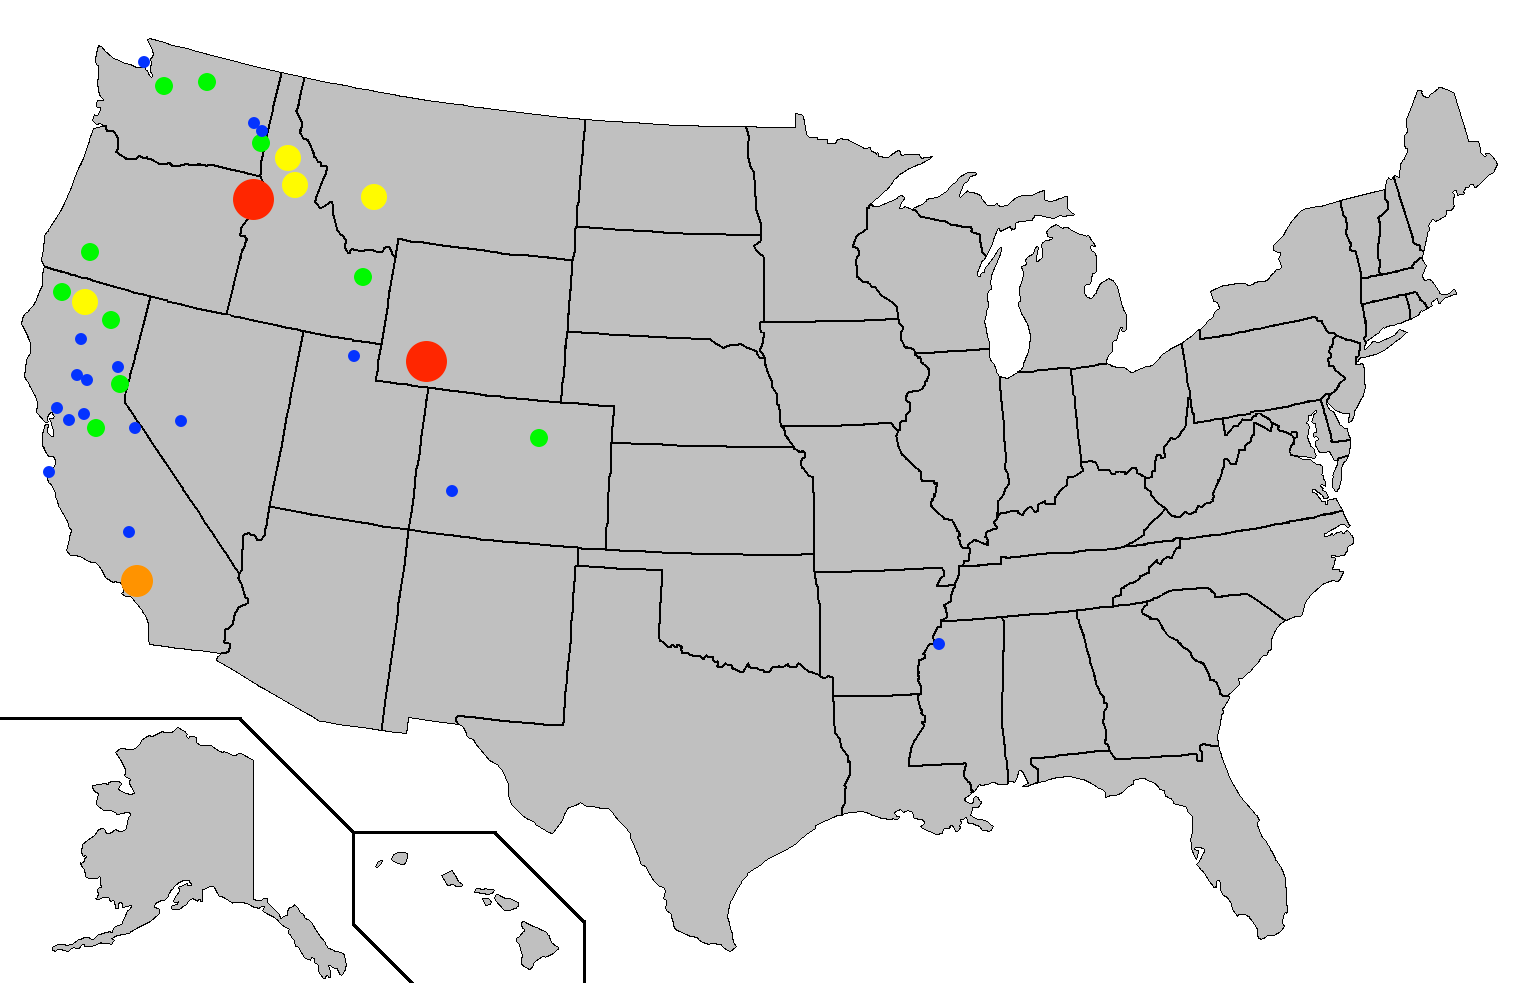
Answer: This proportional symbol map represents the extrajudicial killings of people of Chinese descent in the United States in the century following the American Civil War. The years from 1865 through 1965 saw a tremendous amount of racially motivated violence in the United States. To make this map, we have focused only on the killing of Chinese-Americans. This map includes incidents of lynching, massacres, riots, arsons, and a few individual murders.
The largest red circles on this map represent places in which more than twenty individuals were killed. One red circle indicates Rock Springs, Wyoming, where an 1885 massacre resulted in the deaths of 28 miners of Chinese heritage. That massacre was sparked because white miners resented the fact that Chinese miners in the area were willing to work for lower wages. In addition to the 28 fatalities, rioters torched 75 Chinese homes. The other red circle indicates a spot along the Snake River in the Hells Canyon National Recreation Area now known simply as “Chinese Massacre Cove.” Near this spot in 1887, thirty-four Chinese-American miners were robbed, mutilated, and murdered.
The orange circle on this map indicates a place where between ten and twenty Chinese-Americans were killed. In this case, it refers to the fact that at least 15 people were killed in mob violence in 1871 in Los Angeles’s Chinatown. In that incident, a mob of around 500 white men were incensed by the alleged killing of a white man. They entered Chinatown and hanged at least 15 Chinese men. This incident was the largest single instance of lynching of people of any race at any time in American history.
The definition of what constitutes a “lynching” is open to interpretation. The Tuskegee Institute, a historically black college in Alabama, produced what has long been the most widely accepted definition: there must be evidence that a person was killed, that the person’s death was illegal, that a group of three or more people participated in the killing, and that the group “acted under the pretext of service to Justice, Race, or Tradition.” While this definition applies to some of the incidents on our map, we have cast a much wider net by including the results of any racially motivated killing. This includes instances of robbery and arson in which individuals were killed, as well as a few murders committed by individuals rather than groups.
Most anti-Chinese violence in the United States was not fatal and, consequently, is not represented on this map. In the western part of the country in the latter half of the nineteenth century, it was very common for white mobs to burn down the Chinese section of a particular town and expel that town’s entire Chinese community. Since it is nearly impossible to estimate the number of people affected by these incidents, there is no way to represent them on a proportional symbol map. It would, however, be possible to make a dot map indicating each place where a riot or explusion occurred.
Yet we must also acknowledge that we can never know for certain how many Chinese-American fell victim to racially motivated violence during this period. Some incidents were covered up, while others were simply forgotten. The massacre in Los Angeles remained virtually unknown for nearly 140 years until a historian pieced together the story. In some cases, we know the names of the victims and have at least some understanding of why they were targeted. In others, we may never know. How many other circles ought to be on this map? We can only guess.
One place where there is not a circle on this map is the Salmon-la-Sac area near Roslyn, Washington. A local legend recalls that as many as 25 Chinese laborers were killed in this area in 1880. Some versions of the story recall that they were attacked by Native Americans; others suggest that they were attacked by cowboys. At least one version of the story holds that the attackers were urged on by a local railroad. We have not included this circle on our map because we have deferred to the research of an undergraduate history major at the University of Washington’s Tacoma campus. Having reviewed as many sources as he could find, that student concluded that there is no reliable evidence that the massacre ever actually happened.
Although this map covers a hundred-year period, a majority of the circles on it are present because of incidents that occurred in the 1880s. During this decade, incidents of violence against Chinese people spread from place to place as news of one riot reached nearby cities. The green dot in Issaquah, Washington, is there because of an attack on Chinese miners that occurred one day after news of the Rock Springs Massacre was reported in Seattle newspapers. It is also important to note that much of this violence actually happened after the passage in 1882 of the Chinese Exclusion Act, when Congress responded to anti-Chinese sentiment in the western U.S. by passing a law that forbade all new immigration from China. Someday, perhaps, we may be able to celebrate living in a country where arbitrary racially motivated restrictions on immigration are a thing of the past.
We were inspired to make this map because of a tremendous website called “Monroe Work Today.” Monroe Work was a sociologist at the Tuskegee Institute who devoted his career to recording instances of racially motivated killing. In celebration of his efforts, the Auut Studio, a group that creates resources for history teachers, has created a dynamic map of all known instances of racially motivated mob violence in the century following the Civil War. We are grateful to the people behind Auut Studio and Monroe Work Today for sharing their sources with us and allowing us to use it to create this map. If you visit their site, you can read more about many of the incidents we have mapped, including (wherever they are known) the names of the individual victims.
Next map: Click here to try out our newest map question.
