
Map #28: February 27, 2017
Difficulty Level: 9
Click here for a full-size version of this week’s map.
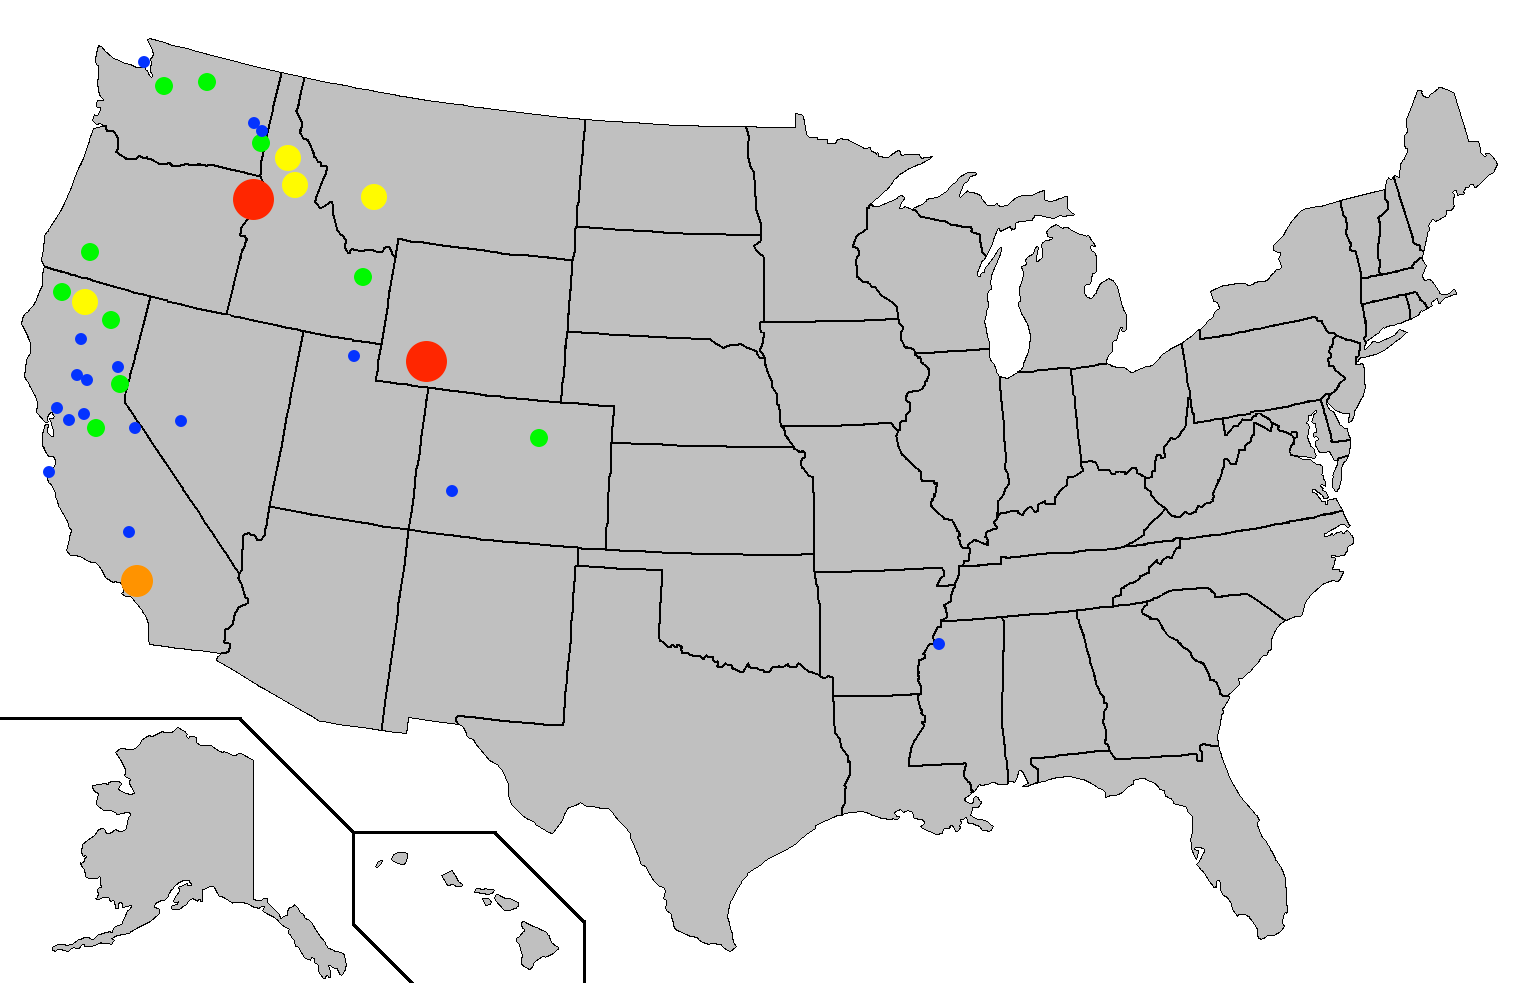
This map is a proportional symbol map of the United States. (Do you need a refresher on what a proportional symbol map is? Visit our “Basics” page for a quick primer.) On this map, the larger symbols indicate particular places with more of something. This is going to be an extremely difficult map, so make sure to check back regularly for helpful hints. The data used to make this map are in some cases open to a bit of interpretation, but they were meticulously collected. When we post the solution, we’ll express our appreciation to the website that gave us both the idea to make this map and the data necessary to put it together. Until then, your job, as always is to figure out what statistic is represented by this proportional symbol map.
Stumped? Check back Tuesday, Wednesday, Thursday, and Friday for hints about where to focus your investigation. The answer will be posted on Monday, March 6. Good luck!
Tuesday’s hint: One thing that stands out about this map is that very few of the dots are in major cities. There’s an orange dot in Los Angeles and a green dot in Denver. After that, the next largest city with a dot is Stockton, California (one of the blue dots). Pretty much all of the other dots are in relatively isolated places. One reason why so many isolated dots show up is that many of them are in places that once had a lot of mining. So your first step might be to think a little bit about how the mining industry developed in the American West.
Wednesday’s hint: Yesterday’s hint mentioned that a lot of these dots point to mining towns in isolated areas, so let’s look a little bit closer at one such dot. The blue dot in Colorado indicates the town of Ouray. If you look up Ouray, Colorado, you’ll see that it experienced some dramatic periods of growth and decline. When the 1880 census was taken, it had 864 residents; by 1890, it was up to 2,534—its peak population. Since Ouray hasn’t been particularly noteworthy in the past 110 years or so (our apologies to any cartography enthusiasts from Ouray who visit this site), you might consider thinking about what happened during Ouray’s heyday. What was happening in the 1880s in the United States?
Thursday’s hint: Most of the dots on this proportional symbol map refer to cities, but there are a few that are in places where there are no cities. In California, two of the dots are in places that were once mining camps; we’ve done our best to locate them, but it requires a bit of guesswork. And on the border between Oregon and Idaho, one of the big red circles is in the Hells Canyon National Recreation Area. Why do we have a dot on a piece of federally owned land that is not home to any permanent residents? Well, maybe you should do a little bit of research to figure out what is special about Hells Canyon.
Friday’s hint: And what about the other big red dot? It represents the city of Rock Springs, Wyoming. If you read about the history of Rock Springs, you should be able to figure this out!
Answer: Click here to see an explanation of the answer to this week’s map question.
Next map: Click here to try out our newest map question.
