
Answer to Map #38
Click here for a full-size version of this week’s map.
Back to this week’s map and hints.
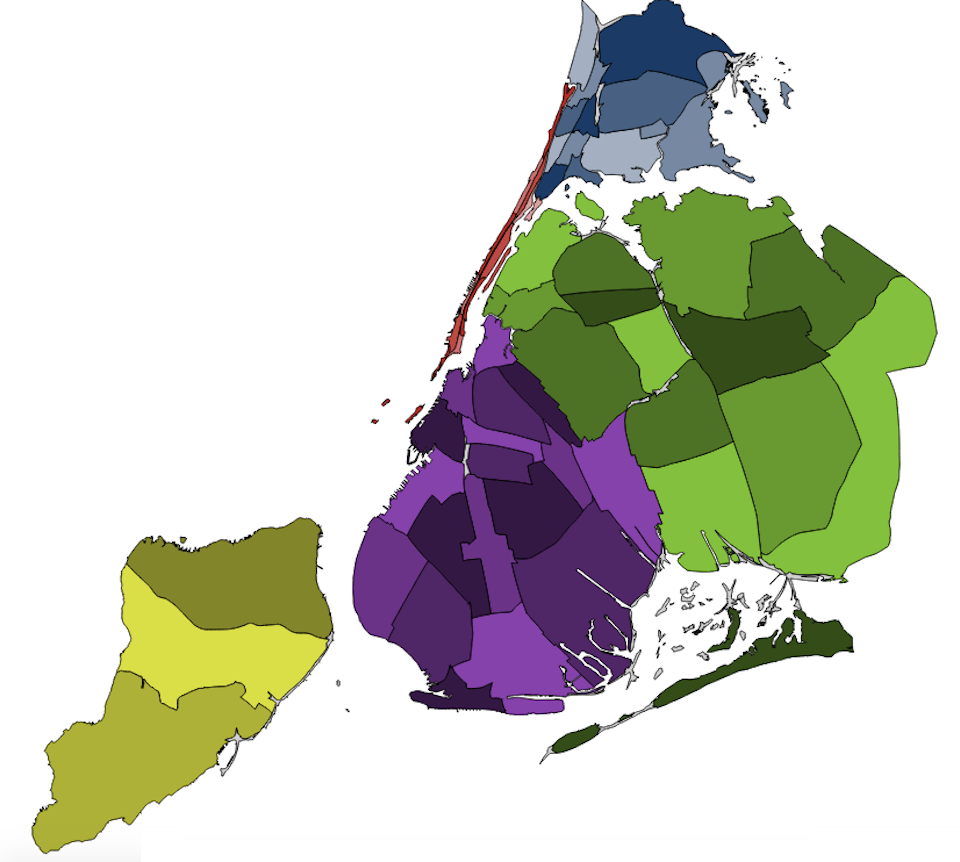
Answer: This cartogram depicts the total number of single-family homes in each community district of New York City.
As you can see, the borough of Manhattan almost entirely disappears on this cartogram. That’s because Manhattan is so densely populated that there are extremely few single-family homes on the island. Manhattan Community District #5, corresponding to Midtown, has the fewest single-family homes of all: fifteen. By contrast, the outlying residential areas of Queens and Staten Island are practically suburban. Staten Island Community District #3 has 39,887 single-family homes; Queens Community District #3 has 43,870. You can find the housing data for each community district on the website of the New York City Department of Planning.
This enormous disparity between the densely populated urban areas and the much more sparsely populated outlying areas makes for a skewed cartogram. As mentioned in Thursday’s hint, by far the most common incorrect answer this week was that the cartogram represented car ownership. Car ownership rates in Manhattan are much lower than in other boroughs, but they are not quite as low as one might think. As you can see from this choropleth of car ownership rates in New York City, the Upper West Side and the Upper East Side, both of which are extremely wealthy areas, are populated by people who can afford to maintain cars, even while living in an expensive city. Consequently, a cartogram of the total number of cars would not look nearly as skewed as this week’s cartogram of single-family homes.
Note that this week’s cartogram is a map of the total number of single-family homes in each community district, not a map of the percentage of homes that house a single family. This is an important distinction. Cartograms are most useful when they map absolute numbers. As an extreme example, consider the difference between a cartogram of the countries of the world by population and a cartogram of the countries of the world by population density. On the first, China and India would be the two largest countries. On the second, the two largest countries would be Monaco and Singapore, both of which have tiny areas. Such a map wouldn’t be useful, and population density data would be better represented with a choropleth. An alarming number of our submitters this week were not careful about this distinction. Sometimes we are fairly lenient with your guesses, but in week #3 of our spring challenge, we have been strict. So if your submitted answer mentioned anything about proportions, percentages, or densities, you did not receive any points.
We were, however, generous about a few answers that are quite similar to the actual solution. In particular, we accepted any answer having to do with total residential area, the total number of houses that have yards, and the total number of homeowners. These statistics are all very closely correlated with the number of houses, and maps of them would look similar to this week’s map.
Next map: Click here to try out our newest map question.
