
Map #101: October 8, 2018
Difficulty Level: 2
Click here for a full-size version of this week’s map.
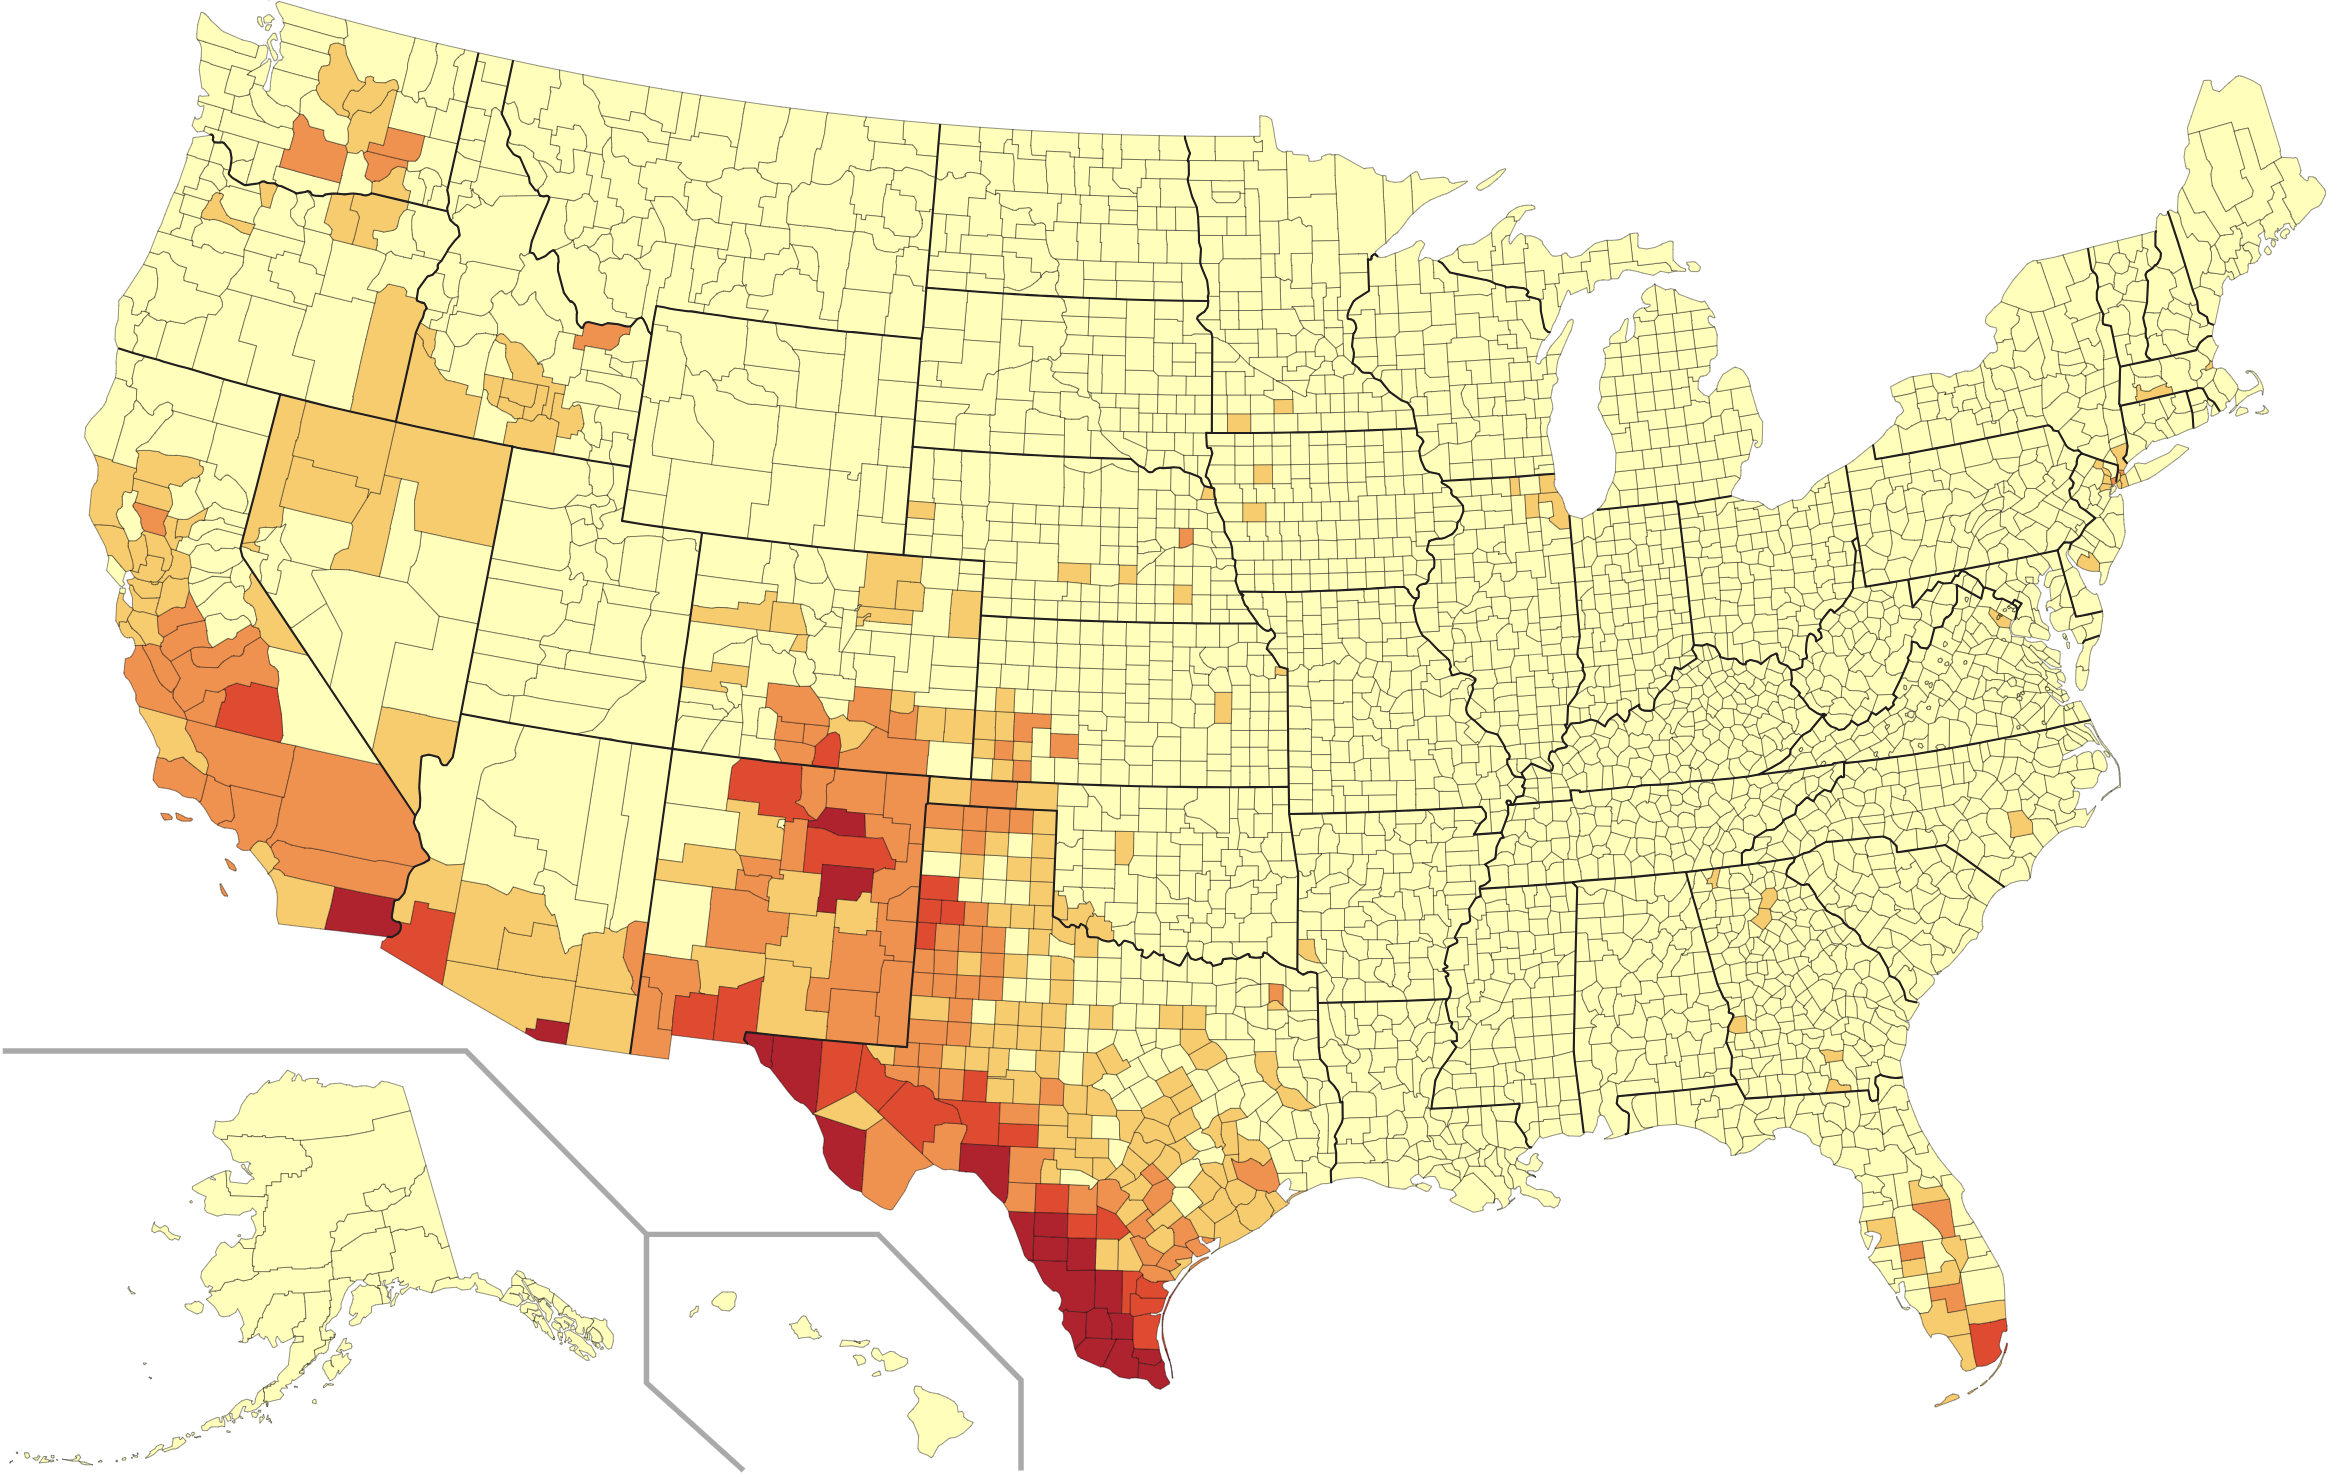
This map is a choropleth of the counties of the United States. (Do you need a refresher on what a choropleth is? Visit our “Basics” page for a quick primer.) Since this is our first county-level U.S. choropleth of the 2018–2019 academic year, we’re starting with what should be quite a gettable map. We’ll plan to do several more county-level choropleths in the coming weeks that will ramp up in difficulty. As always, your job is to figure out what this choropleth represents.
Stumped? Check back Tuesday, Wednesday, Thursday, and Friday for hints about where to focus your investigation. The answer will be posted on Monday, October 15, 2018. Good luck!
Wednesday’s hint: Let’s start in New York City: did you zoom in and notice that the Bronx is quite a lot darker than the other four boroughs?
Thursday’s hint: Some of the places on this map with lots of color are in the interior parts of California and Washington. These are agricultural areas—and, in particular, these are areas where a lot of land is devoted to growing fruit. Fruit requires a lot of labor, since more often than not it has to be picked by hand.
Friday’s hint: With this map, it’s important not to get too distracted by all the dark counties along the border with Mexico. Make sure you notice that there’s a certain diversity of counties that are darkly colored, including around the cities of New York City and Miami.
Saturday’s hint: This map uses information from the U.S. Census about race.
Answer: Click here to see an explanation of the answer to this week’s map question.
Next map: Click here to try out our newest map question.
