
Answer to Map #79
Click here for a full-size version of this week’s map.
Back to this week’s maps and hints.
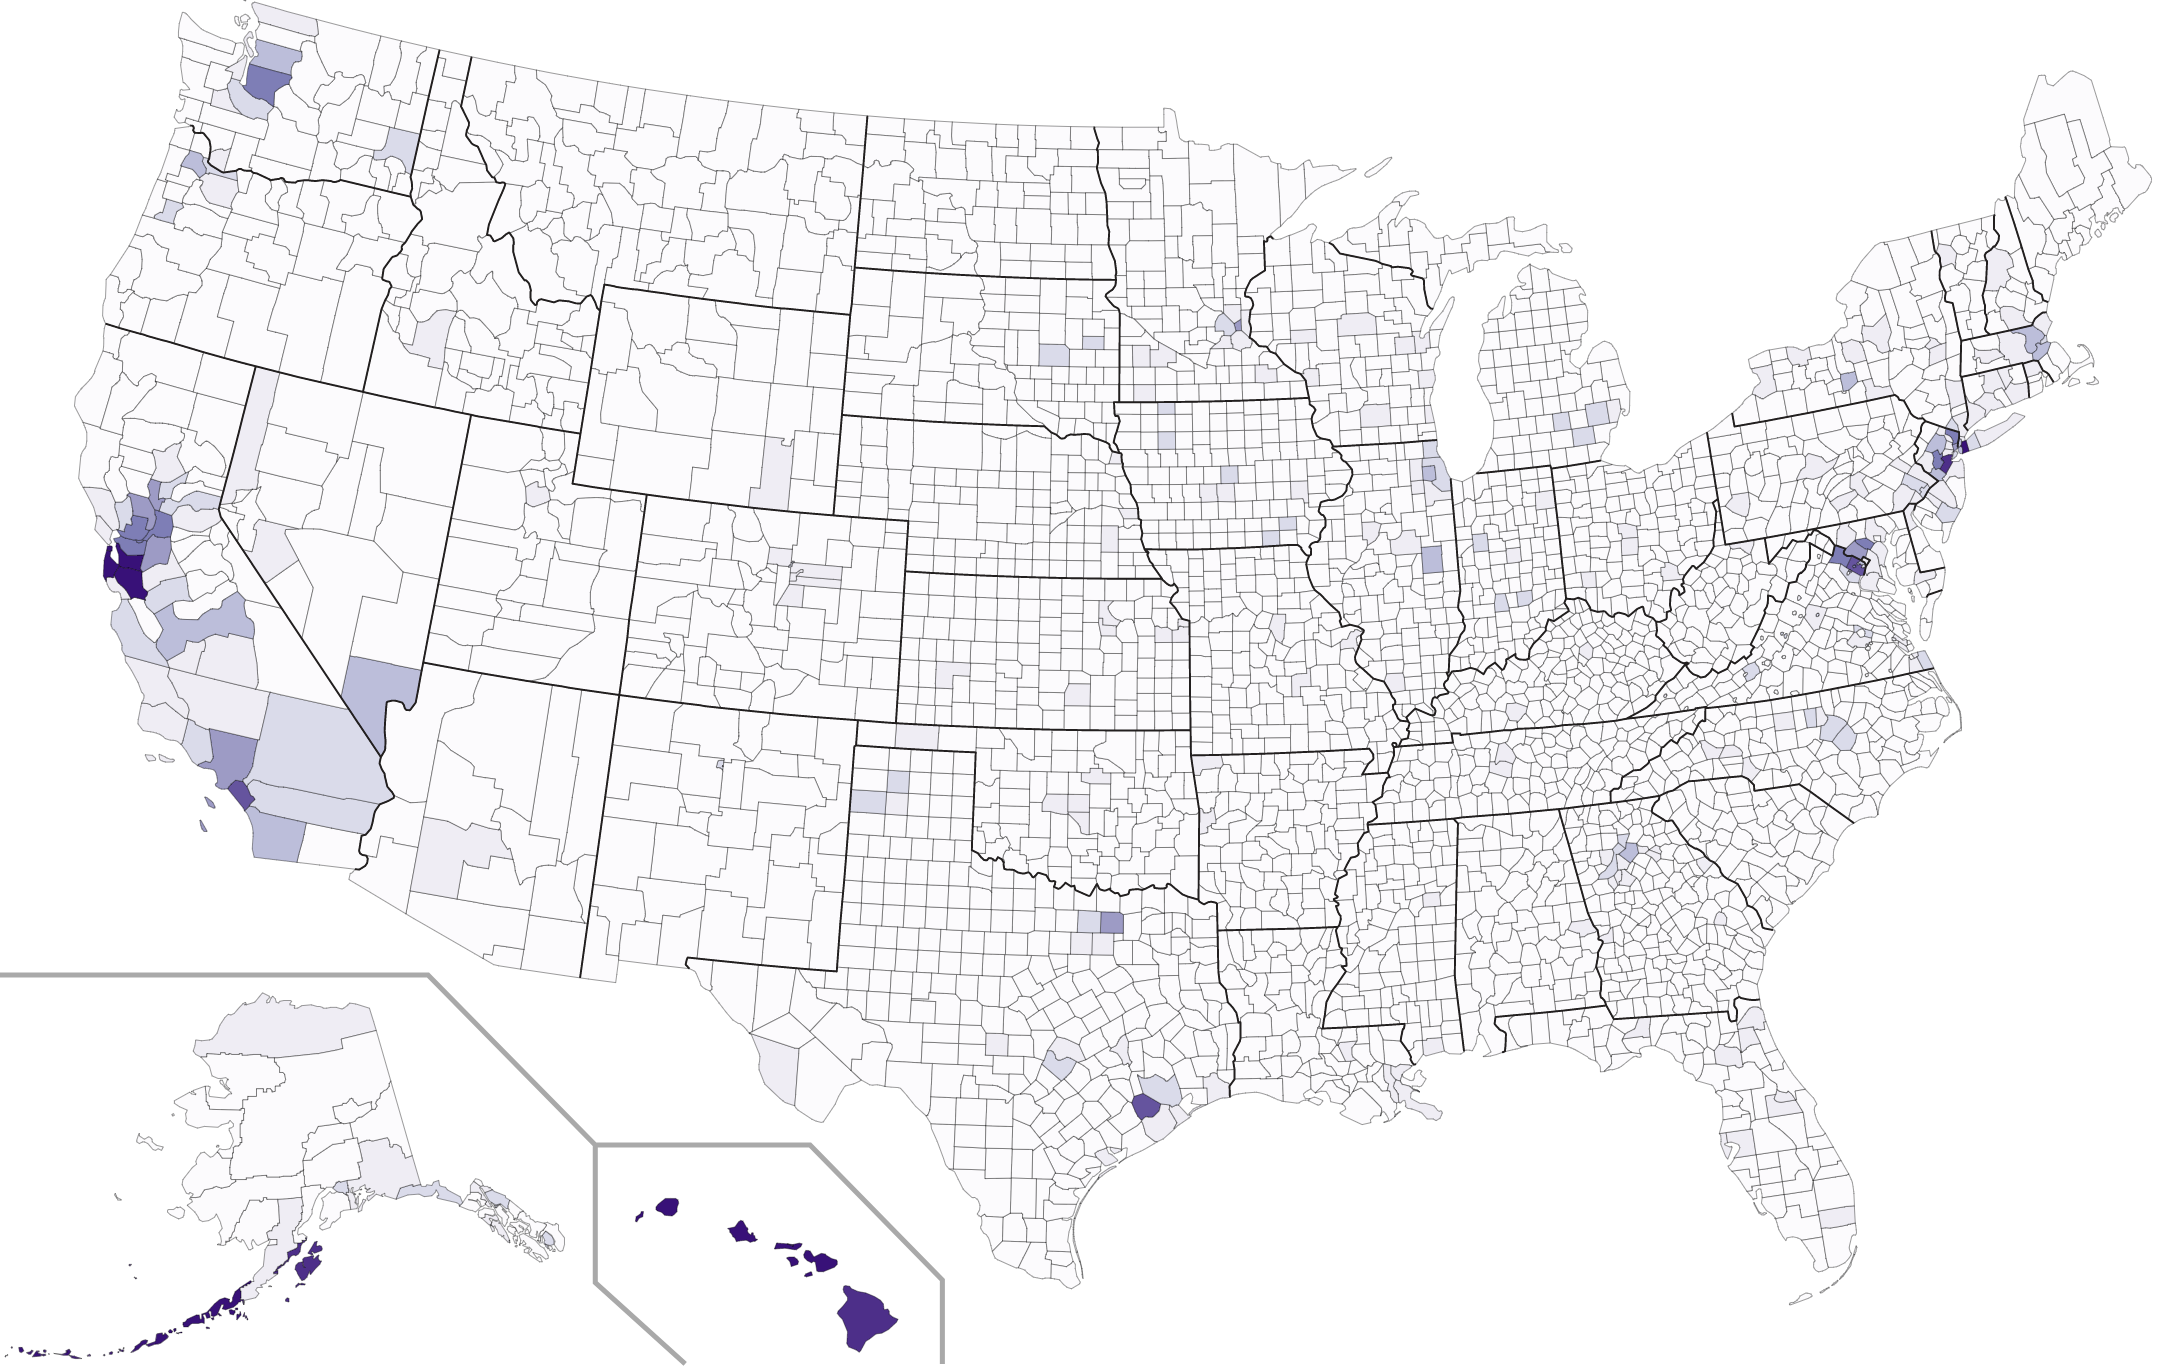
Answer: This week’s map was a choropleth depicting the percentage of the population in each U.S. county that identifies its race as “Asian.”
The data used to make this map came from the 2015 American Community Survey. The linear scale we used accentuated the counties with large Asian American populations. The darkest color indicates counties where the Asian population exceeds 24%. The second-darkest color is for counties that are more than 21% Asian, and so on, down by increments of 3%. The lighest color is for all counties less than 3%—the vast majority of counties. Had we chosen a logarithmic scale instead, we could have accentuated the differences between counties with much smaller Asian American populations, but the overall map would have been more difficult to figure out.
The areas with the highest Asian populations are Honolulu County, Hawaii (42.6%); Aleutians West Census Area, Alaska (37.2%); Kauai County, Hawaii (35.6%); San Francisco County, California (33.8%); Santa Clara County, California (33.8%); and Aleutians East Borough, Alaska (30.5%). Our scale doesn’t help at all to distinguish among these counties, since all have Asian American populations far in excess of 24%.
Hawaii has been home to a significant number of people of Asian heritage since the early nineteenth century, when immigrants began arriving to work on sugar cane plantations. For a long time, Japanese Americans made up one of the largest communities in Hawaii. In 1920, about 43% of the people of Hawaii could trace their origins to Japan. Now, however, Japanese Americans make up only about 17% of the population. Now, Hawaii has large communities of immigrants from other Asian countries, including China and the Philippines. Along with New Mexico, Hawaii is one of only two U.S. states that has never had a (non-Hispanic) Caucasian majority since joining the union.
One of the interesting features of this map is that different counties are home to communities from many different places. In one of this week’s hints, we highlighted one of the largest Vietnamese American communities in Orange County. Orange County, of course, is also home to large communities from other Asian countries. We also highlighted the fact that about 22% of the people in Alaska’s Aleutians East Borough speak Tagalog, the most common language of the Philippines. That statistic reflects the fact that some remote parts of Alaska have received relatively large numbers of Filipino immigrants. One interesting thing to do with this map is to try to figure out which countries of origin account for the dark colors in each county that sticks out.
We say there has been a “relatively” large number of Filipino immigrants to the Aleutian Islands because the population of the Aleutians remains extremely small in terms of absolute numbers. The American Community Survey’s estimate was that there are 1,009 people of Asian heritage in the Aleutians East Borough out of a total population of 3,304. That’s good for a high percentage, but it’s not a large number overall. Just a few families could skew the demographics a lot.
The county with the largest number of Asian Americans is Los Angeles County, and it’s not even close. Los Angeles County is home to an estimated 1,418,362 people of Asian heritage out of a population of 10,038,388, or 14.1%. Of course, Los Angeles County is the most populous county in the U.S., so it’s hardly surprising that they would lead. The counties with the next most Asian Americans are Santa Clara County, California (630,704); Orange County, California (590,342); and Queens County, New York (561,128).
One nice thing about county-level choropleths is that they can draw your attention to intriguing counties you wouldn’t otherwise have noticed. One such county is Fort Bend County, Texas, which has the highest percentage of Asian Americans in the South. Fort Bend County, which contains some suburbs of Houston, has grown a lot in the past few decades. For middle class communities in Houston, Fort Bend County has offered an affordable place to live. As a result, Fort Bend County has become one of the most diverse counties in the country according to several studies.
Next map: Click here to try out our newest map question.
