
Map #77: February 12, 2018
Difficulty Level: 5
Click here for a full-size version of this week’s map.
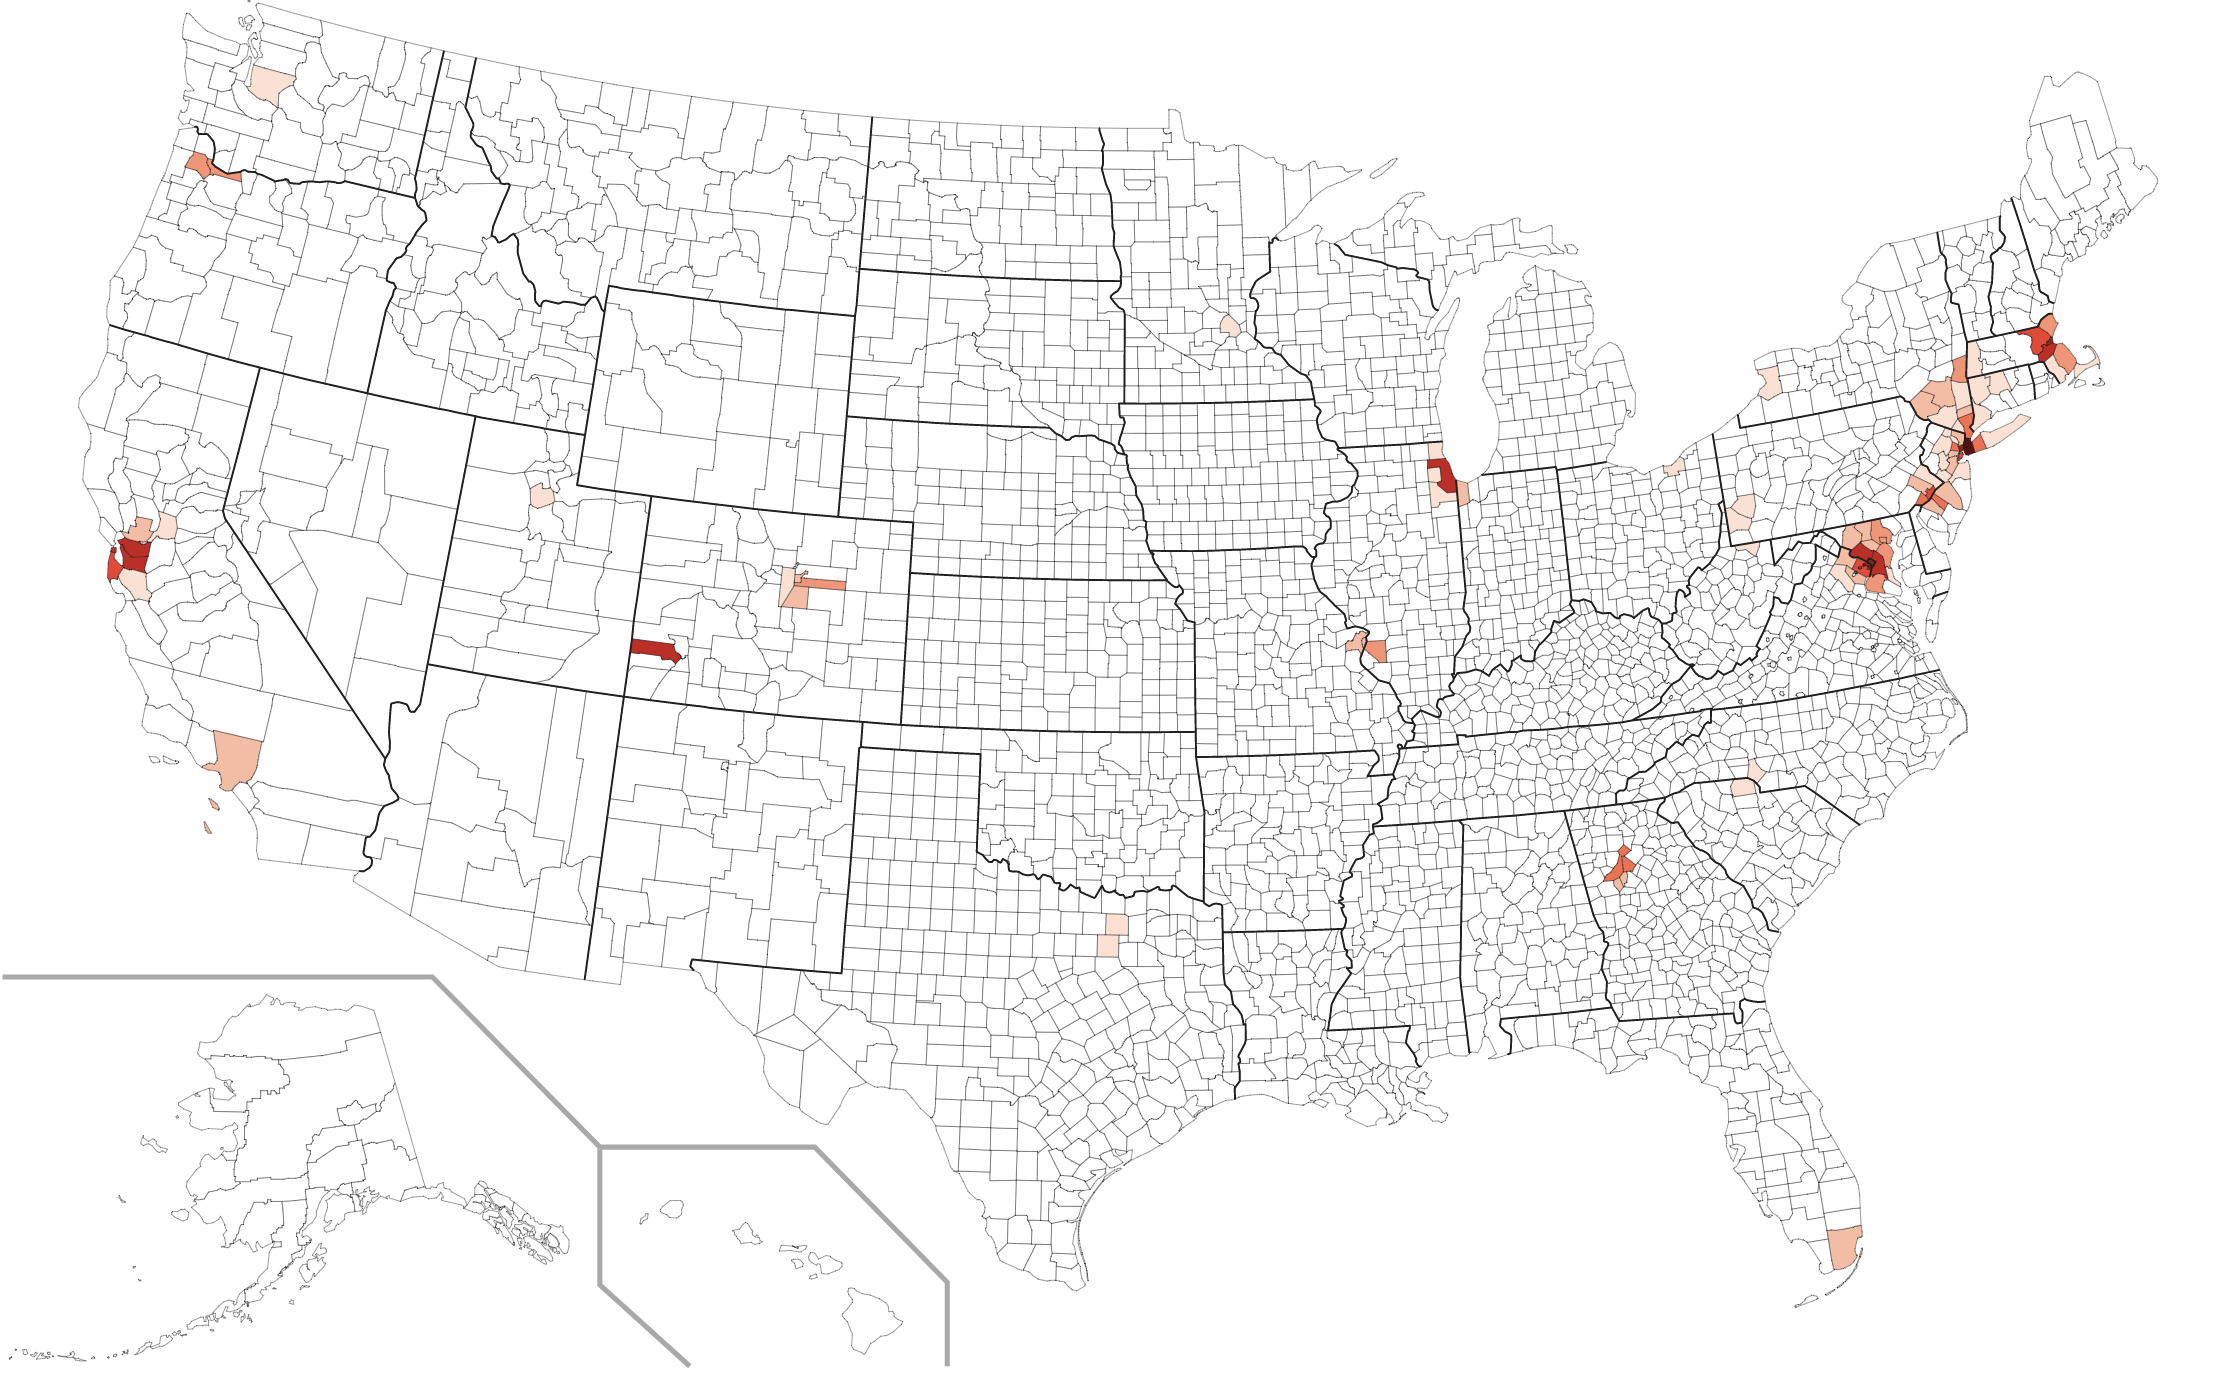
This map is a choropleth of the counties of the United States. (Do you need a refresher on what a choropleth is? Visit our “Basics” page for a quick primer.) This map uses an exaggerated scale, so the darkest areas are quite a lot darker than the rest of the map. We had to clean up the data a little bit because there are some counties with very small populations where some of the official statistics are obviously skewed. When we started making this map, we figured it would be pretty straightforward, but it ended up with a few weird bits that have to do with the specific way the American Community Survey phrases its questions. We’ll talk about the idiosyncrasies of this map in the hints; for now, you should try not to worry too much if you find a county that is surprisingly dark or a county that you think ought to be darker. As always, your job is to figure out what this choropleth represents.
Stumped? Check back Tuesday, Wednesday, Thursday, and Friday for hints about where to focus your investigation. The answer will be posted on Monday, February 19, 2018. Good luck!
Tuesday’s hint: The first thing to do with this map is to make a list of the urban areas that appear especially dark. For now, just ignore the lighter urban areas plus any non-urban areas that look dark. Your list should include New York, Boston, Philadelphia, Washington, Chicago, Atlanta, St. Louis, San Francisco, and Los Angeles. These nine cities have something particular in common!
Wednesday’s hint: A lot of people are overthinking this map. In general, your best bet is probably to ignore San Miguel County, Colorado, entirely. Just pretend it doesn’t exist and submit the answer you would come up with otherwise. But since we’re talking about it, let’s briefly discuss this particular county. It’s an extremely unpopulous county in western Colorado that is known mainly for being the home of Telluride, a fancy ski resort. The town of Telluride is actually at the bottom of a valley, though many people live up the hill from Telluride in Mountain Village. By and large, it seems to be the people who live in Mountain Village who account for the peculiar pattern on this week’s map. But once again: you are probably going to be best off if you ignore these people entirely and just don’t worry about this county.
Thursday’s hint: This map is about usage of a particular type of transportation.
Friday’s hint: We’re going to try something a bit different with today’s hint. We will actually tell you the solution to the map: this choropleth depicts the percentage of people in each U.S. county who answered on the 2015 American Community Survey that they had commuted to work within the last week by “subway or elevated.” Now, can you earn one point for the week by telling us why San Miguel County, Colorado—which certainly does not have a subway!—is so dark on this map?
Answer: Click here to see an explanation of the answer to this week’s map question.
Next map: Click here to try out our newest map question.
