
Map #73: January 15, 2018
Difficulty Level: 9
Click here for a full-size version of this week’s map.
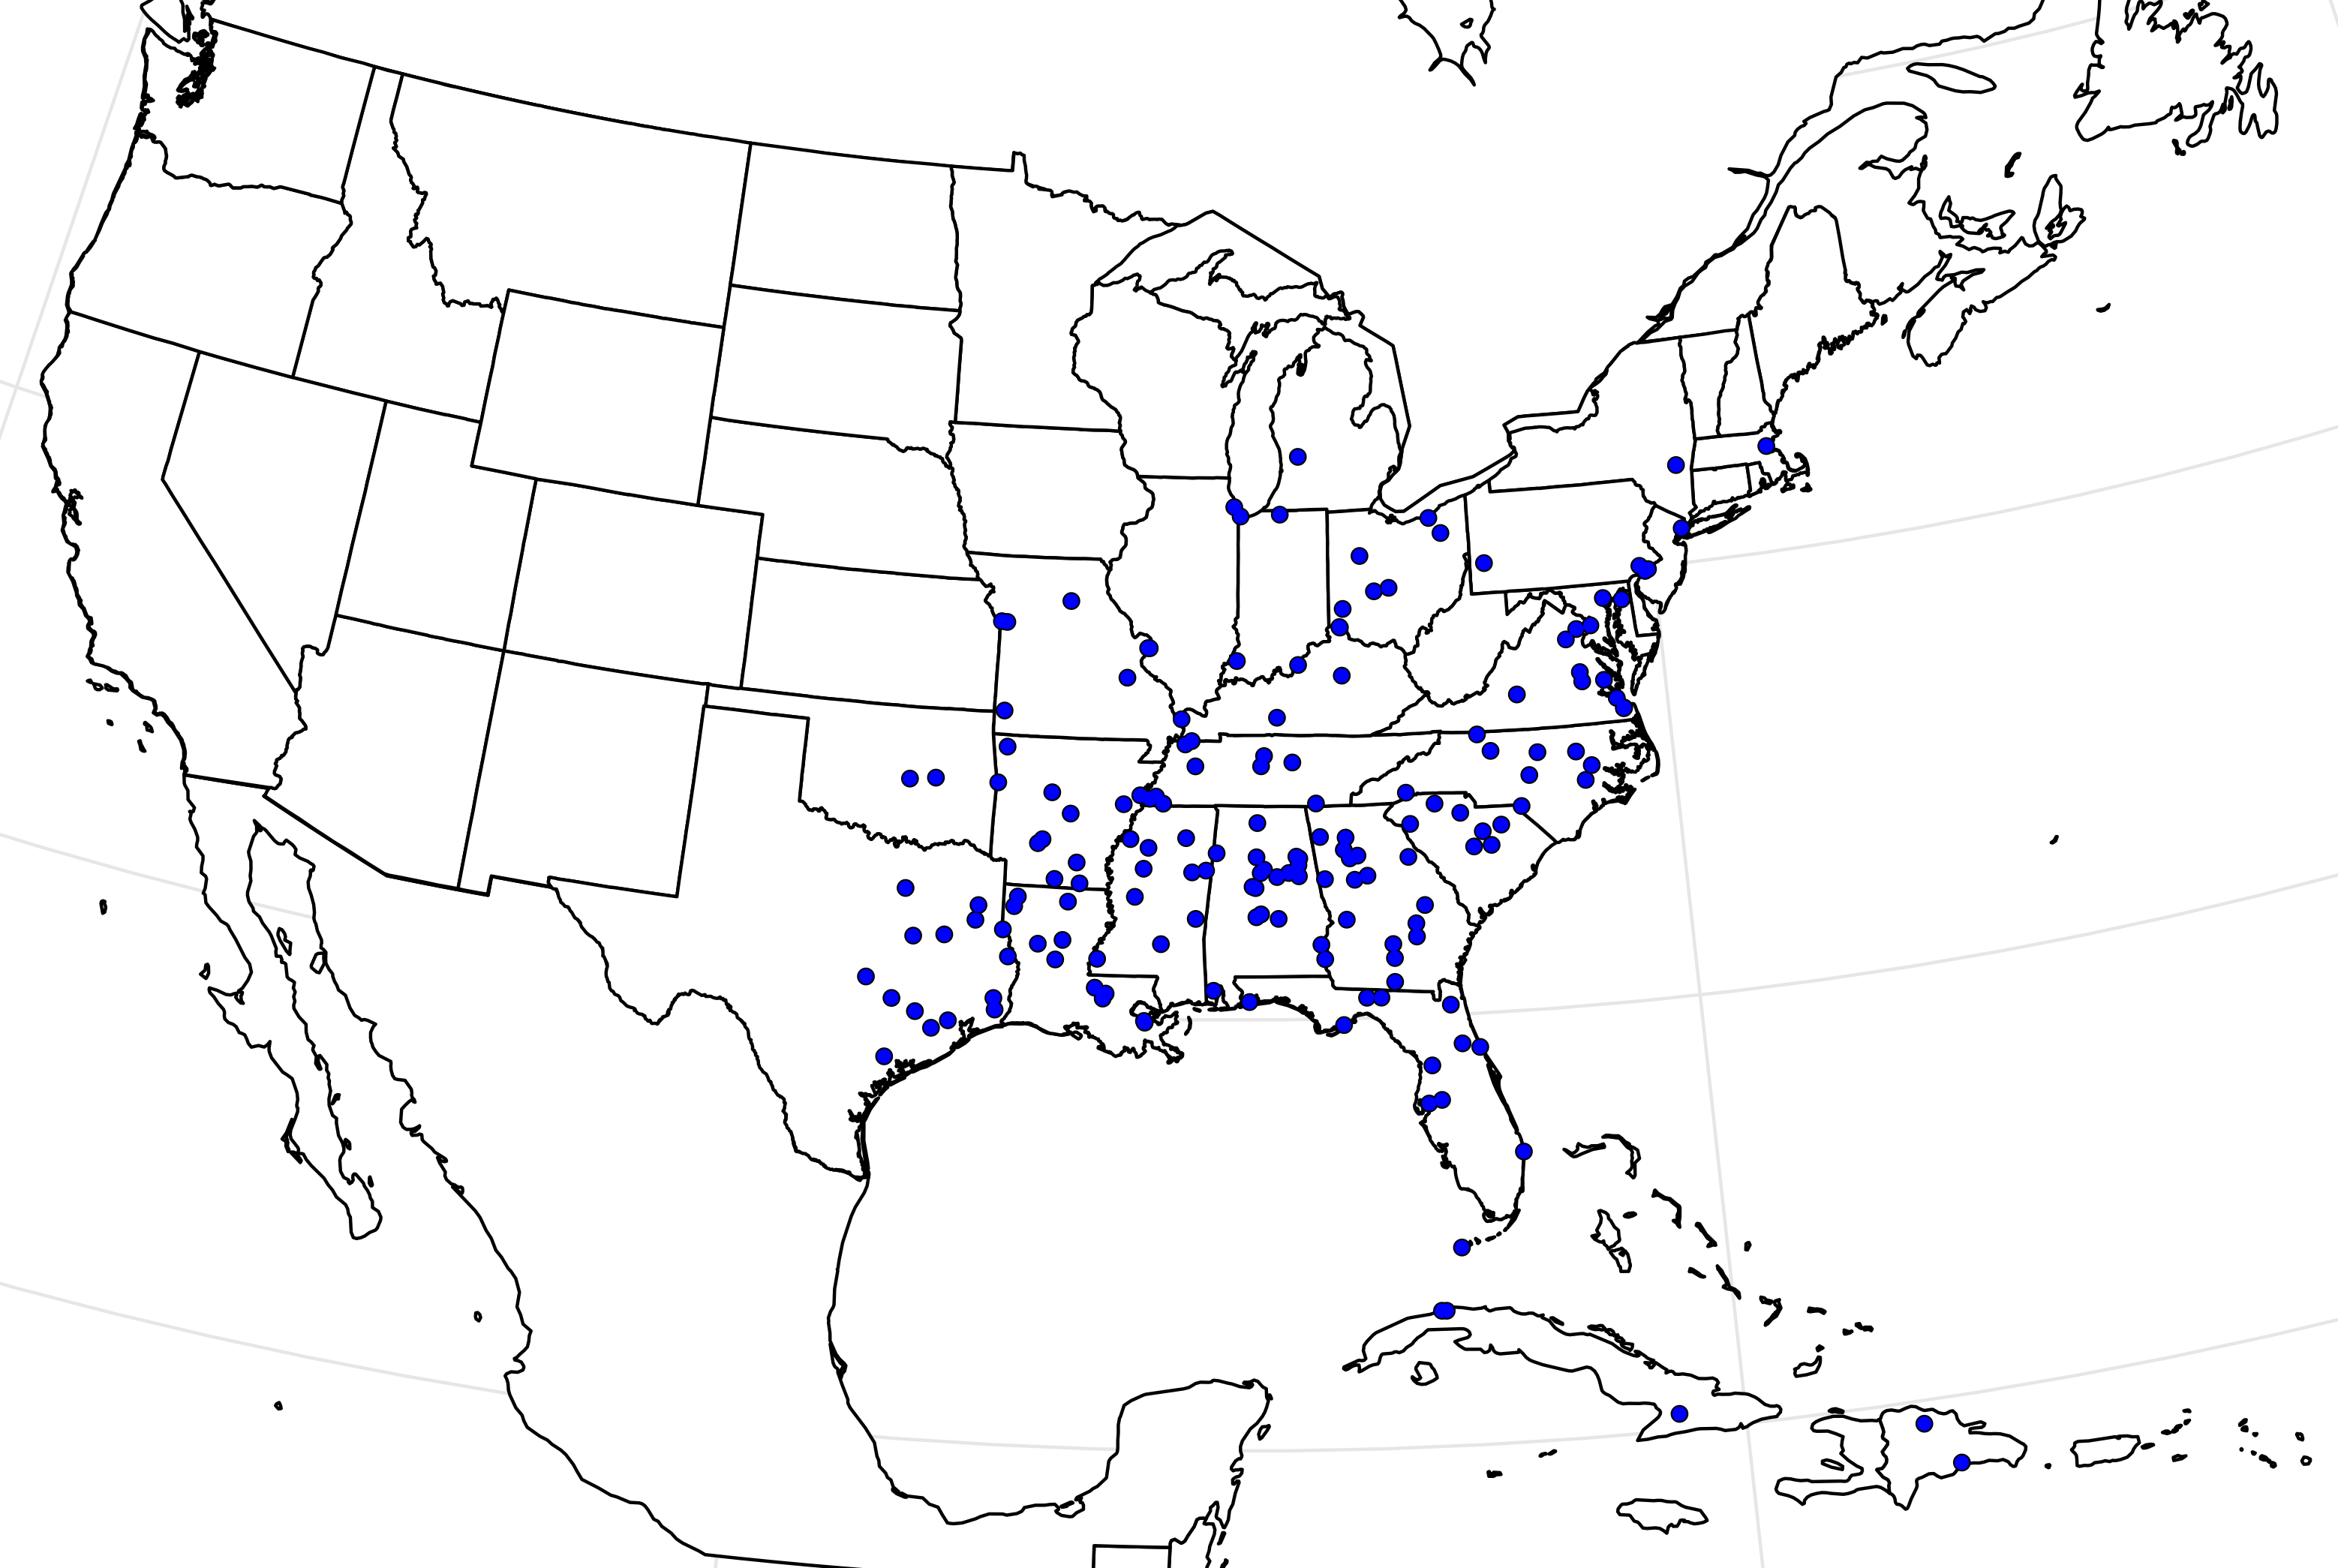
This map is a dot map of North America. (Do you need a refresher on what a dot map is? Visit our “Basics” page for a quick primer.) This is an extremely difficult map, so don’t despair if you can’t make sense of it right away! We’ll tell you up front that the data used to make this map came from the year 1942. As always, your job is to figure out what this dot map represents.
Stumped? Check back Tuesday, Wednesday, Thursday, and Friday for hints about where to focus your investigation. The answer will be posted on Monday, January 22, 2018. Good luck!
Tuesday’s hint: One nice thing about having a map from 1942 is the opportunity for you to learn a little bit of history. In this case, you might want to bear in mind that 1942 came at the beginning of the Second Great Migration. The patterns evident on this map reflect a situation before that phenomenon really got underway.
Wednesday’s hint: The dots on this map represent the birthplaces of a certain group of people. But by 1942, most of those people no longer lived in the places where the dots are. Instead, they all spent much of their time in one of the following cities: Baltimore, Birmingham, Chicago, Cincinnati, Jacksonville, Kansas City, Memphis, Newark, New York, Philadelphia, or Pittsburgh. (And depending on timing, you may or may not want to add Cleveland and/or Washington to that list.)
Thursday’s hint: As you might have realized from the pattern of dots stretching across the so-called Cotton Belt of the American South, or else from Tuesday’s hint about the Great Migration, the people whose birthplaces were indicated by the dots in question were African Americans. This week’s map is a fitting one to have been posted on Martin Luther King Day, since it is an examination of one particular aspect of this history of racial segregation—though an aspect that was ended some years before King became active in the Civil Rights movement.
Friday’s hint: Let’s talk about some of the individual dots you can find on this map—and about what you might see if you visited the towns they represent. One dot indicates the town of Buena Vista, Georgia, which currently has a population of just over 2,000 people. When you drive into the town, you are likely to see its water town emblazoned with the words, “Home of Josh Gibson.” Another dot marks Rocky Mount, North Carolina, a somewhat larger city with just under 60,000 people. If you go there, you may be interested in paying a visit to Buck Leonard Park. There’s also a dot in Camden, South Carolina, a town with just over 7,000 people. If you go to Camden, be sure to check out the Larry Doby Sports Complex.
Answer: Click here to see an explanation of the answer to this week’s map question.
Next map: Click here to try out our newest map question.
