
Answer to Map #42
Click here for a full-size version of this week’s map.
Back to this week’s maps and hints.
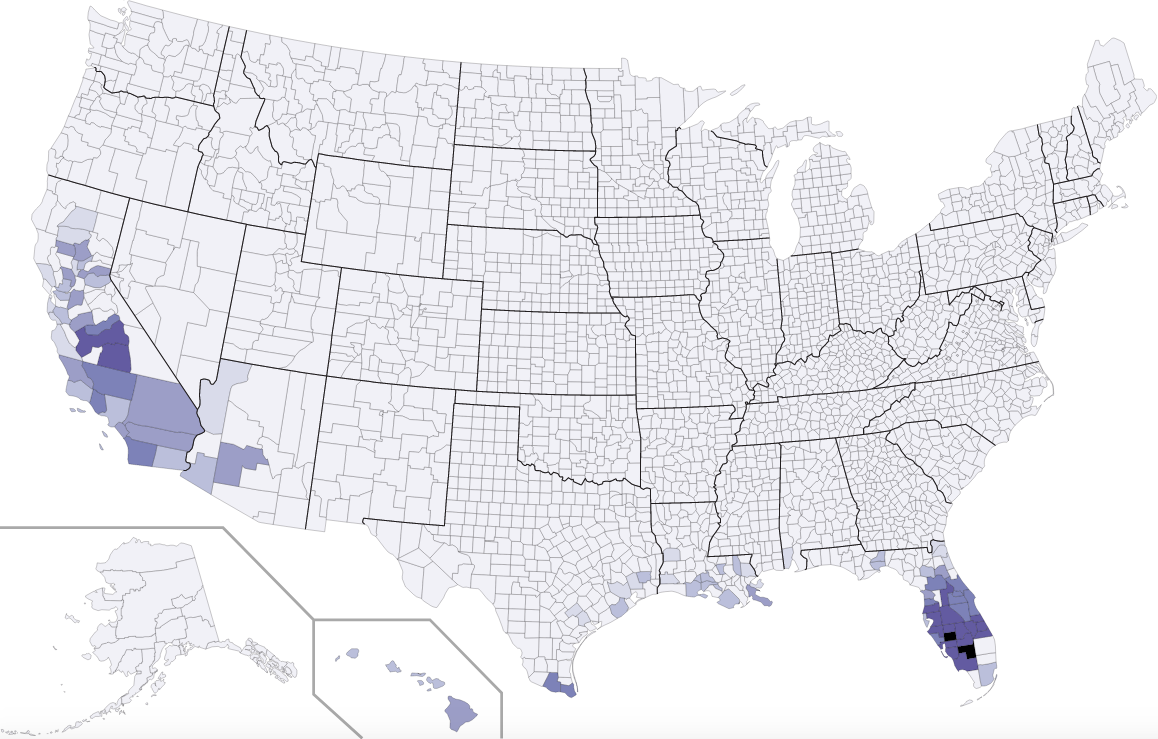
Answer: This week’s map was a choropleth in which the counties of the United States were shaded according to the percentage of land devoted to growing oranges.
We were fairly generous this week. In order to receive full credit for your answer, pretty much all you had to do was mention the words “orange” or “citrus.” But the few of you who precisely identified that this choropleth mapped the percentage of land occupied by orange groves earned a well-deserved bonus point.
The data used to make this map came from the 2012 U.S. Census of Agriculture, which is conducted by the Department of Agriculture. This census does not go into specific detail about acreage in counties that have only a few farms growing oranges because the government does not want you to be able to learn about individual farms from what are supposed to be cumulative statistics. But this shouldn’t have affected our map. In general, what the statistics make clear is that orange production is highly concentrated (no pun intended) in a few key counties. Only Florida, Louisiana, Texas, Arizona, California, and Hawaii registered any counties with significant commercial orange production at all.
On this map, the darkest shade indicates counties where more than 10% of the land is occupied by orange groves. The second darkest shade indicates counties where between 1% and 10% of the land is occupied by orange groves. And so on. This was our first truly base-ten logarithmic scale.
The county that has the largest total amount of land devoted to growing oranges is Hendry County, Florida (95,883 acres, or 13.0% of the total land). The county with the second largest total amount of land devoted to growing oranges is Tulare County, California (89,286 acres, or 2.9% of the total land). Since Tulare County is an extremely large county in terms of area, the percentage is actually not that high. Tulare County has the second most acres devoted to orange cultivation, but only the tenth highest percentage. This is an important distinction, and this was the kind of subtlety that the people who earned six points this week were able to notice.
Although Tulare County is a significant orange producer, this map makes clear just how important central Florida is for the U.S. orange crop. As mentioned in this week’s hints, Florida and Brazil are by far the biggest orange producing areas in the world. Having so much of this country’s production centered in one area means that the entire industry is vulnerable to changing climate patterns. If Florida experiences particularly bad weather at the wrong time of year, the price of oranges can swing wildly as a result.
Both Florida and California are home to counties named Orange County. Where do they fall on our list? Florida’s Orange County has 5,017 acres under cultivation, or about 0.86% of the total area of the county. Orange County, California, has a measly 184 acres under cultivation, or about 0.031% of the total area of the county. Alas, this small number starts to make sense when you consider how valuable the land in Southern California is today. In the early 1960s, the Walt Disney Company purchased 160 acres of orange and walnut groves in Anaheim in order to build Disneyland. That fact alone tells you that these percentages would once have been considerably higher!
Next map: Click here to try out our newest map question.
