

Answer to Map #39
Here are links to larger versions of Map #39a (blue), Map #39b (green), Map #39c (orange), and Map #39d (purple).
Back to this week’s maps and hints.
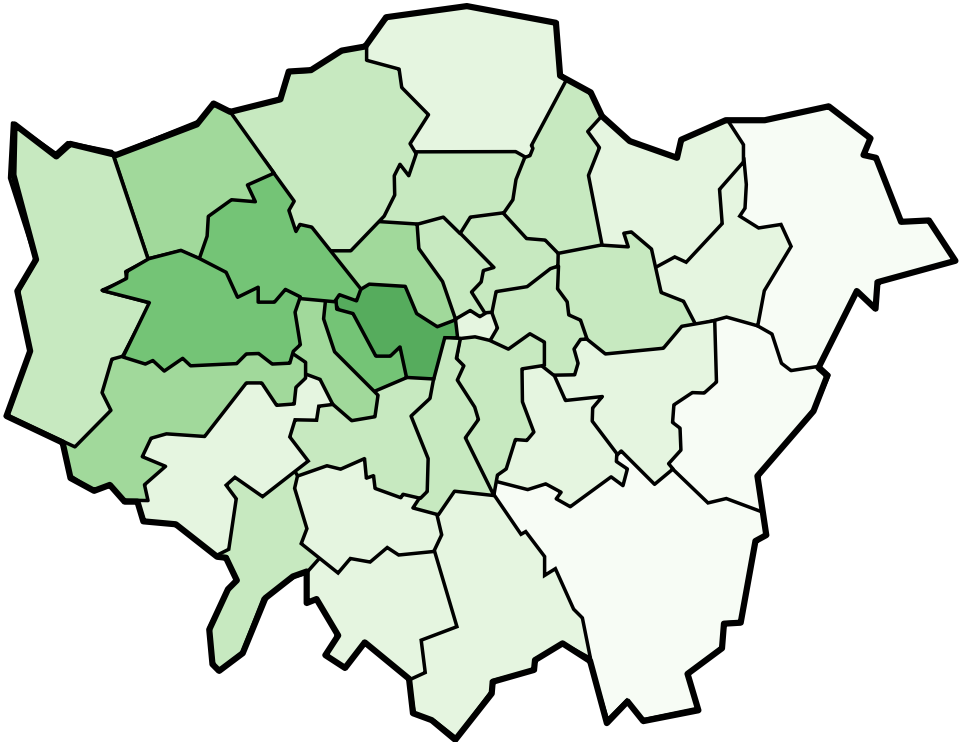
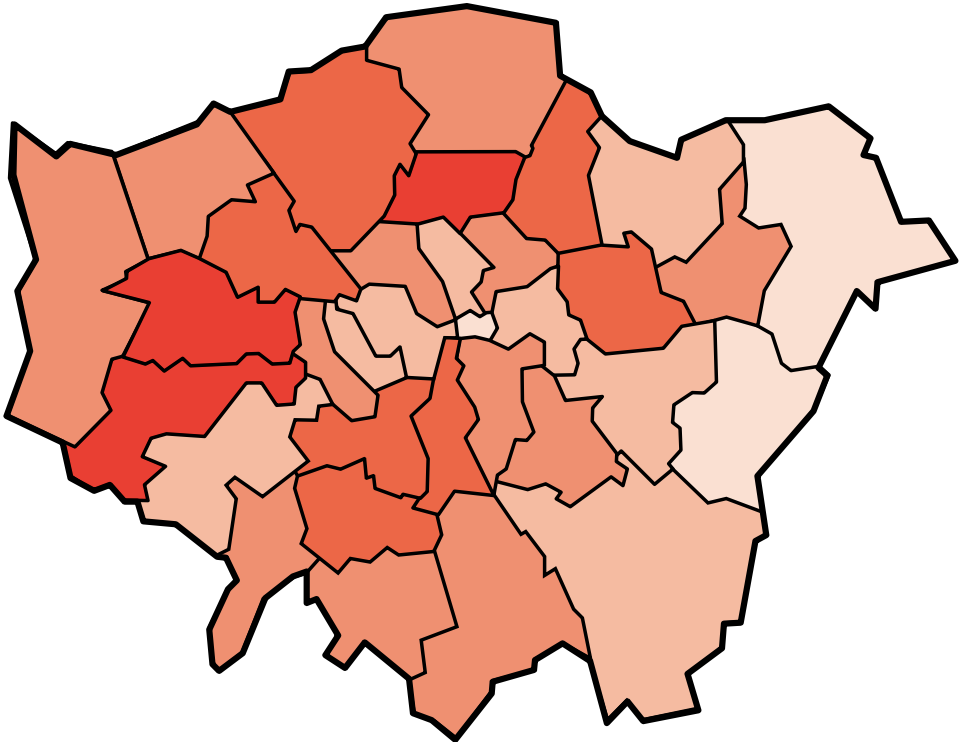
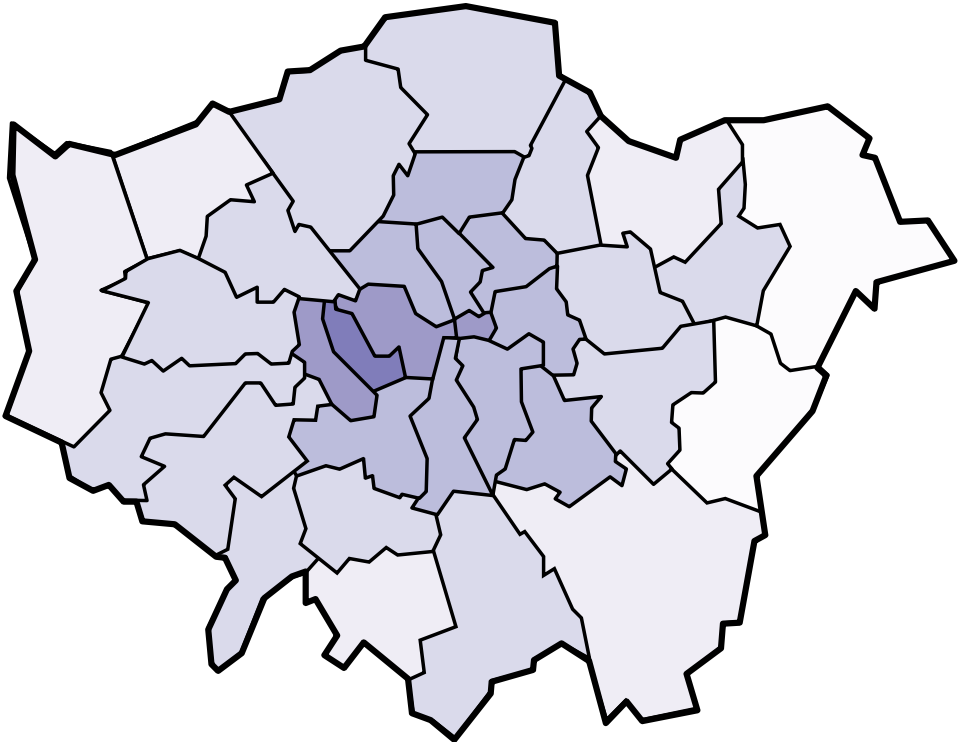
Answer: These choropleths depict the percentages of residents in each borough of London who are first-language speakers of several foreign languages. Map #39a (blue) indicates speakers of Bengali. Map #39b (green) indicates speakers of Arabic. Map #39c (orange) indicates speakers of Polish. Map #39d (purple) indicates speakers of French.
For this week, we gave generous partial credit to people who guessed some, but not all, of the languages correctly. We also accepted answers relating to nationality or ethnicity instead of language. For example, if you guessed that the green map depicted the percentages of Arabs in each London borough, then you earned the same number of points as somebody who guessed that the map depicted the percentage of speakers of Arabic. After all, it makes sense that those two maps would be all but indistinguishable. In adopting this policy, however, we have allowed some of you to get away with imprecision. While most of the Bengali-speaking immigrants in London hail from Bangladesh, it is important to note that there are also some Bengali speakers who have immigrated from India. And while France is certainly the largest source of French-speakers in London, you would also find native French-speakers from such places as Belgium, Switzerland, Canada, Haiti, and Francophone Africa.
The data used to make this map came from the London Datastore. The scales were consistent across all four maps. The darkest shade (used only to color in Tower Hamlets on the map of Bengali speakers) indicated boroughs where more than 16% of residents were native speakers of the language in question (17.96% of people in Tower Hamlets speak Bengali as a first language). The second darkest shade would have indicated boroughs where more than 8% of residents were native speakers of the language in question, but it was not necessary to use it on any of the four maps—an indication just how remarkable the concentration of Bengali speakers in Tower Hamlets is. The third darkest shade indicated boroughs where more than 4% of residents were native speakers of the language in question. This shade was used for Ealing (6.34% Polish), Haringey (4.31% Polish), Kensington and Chelsea (4.88% French), Newham (7.40% Bengali), and Westminster (5.66% Arabic).
Because the scales are consistent across the four maps, you can tell fairly easily which of the four languages has the most total speakers in London: Polish. Whereas speakers of the other languages tend to cluster around particular boroughs, Polish speakers comprise a significant percentage of the population across the city. Overall, there are 147,816 native Polish speakers in London. The second most common foreign language is Bengali (114,267), followed by Gujarati (101,676).
Each of the languages on this week’s maps are particularly common in certain boroughs. For most of you, noticing those particular boroughs was key to solving the map. In some of the hints, we mentioned cultural phenomena associated with particular ethnic groups. For instance, Wednesday’s hint refered to Brick Lane, a novel about a Bangladeshi woman living in Tower Hamlets. The title of the book refers to a street in that borough that has long been associated with the Bangladeshi community. Thursday’s hint mentioned Edgware Road, a street in Westminster that is famous for its many Arab restaurants.
Of the languages depicted in these maps, Polish and French are the two that are likely to be most affected by the outcome of “Brexit,” the process of the United Kingdom leaving the European Union. Under the E.U., the United Kingdom was obliged to allow citizens of other E.U. countries to work without first obtaining visas. It will be interesting to see in the next several years whether the number of speakers of European languages in London decreases as these laws change.
Next map: Click here to try out our newest map question.
