
Map #21: January 9, 2017
Difficulty Level: 9
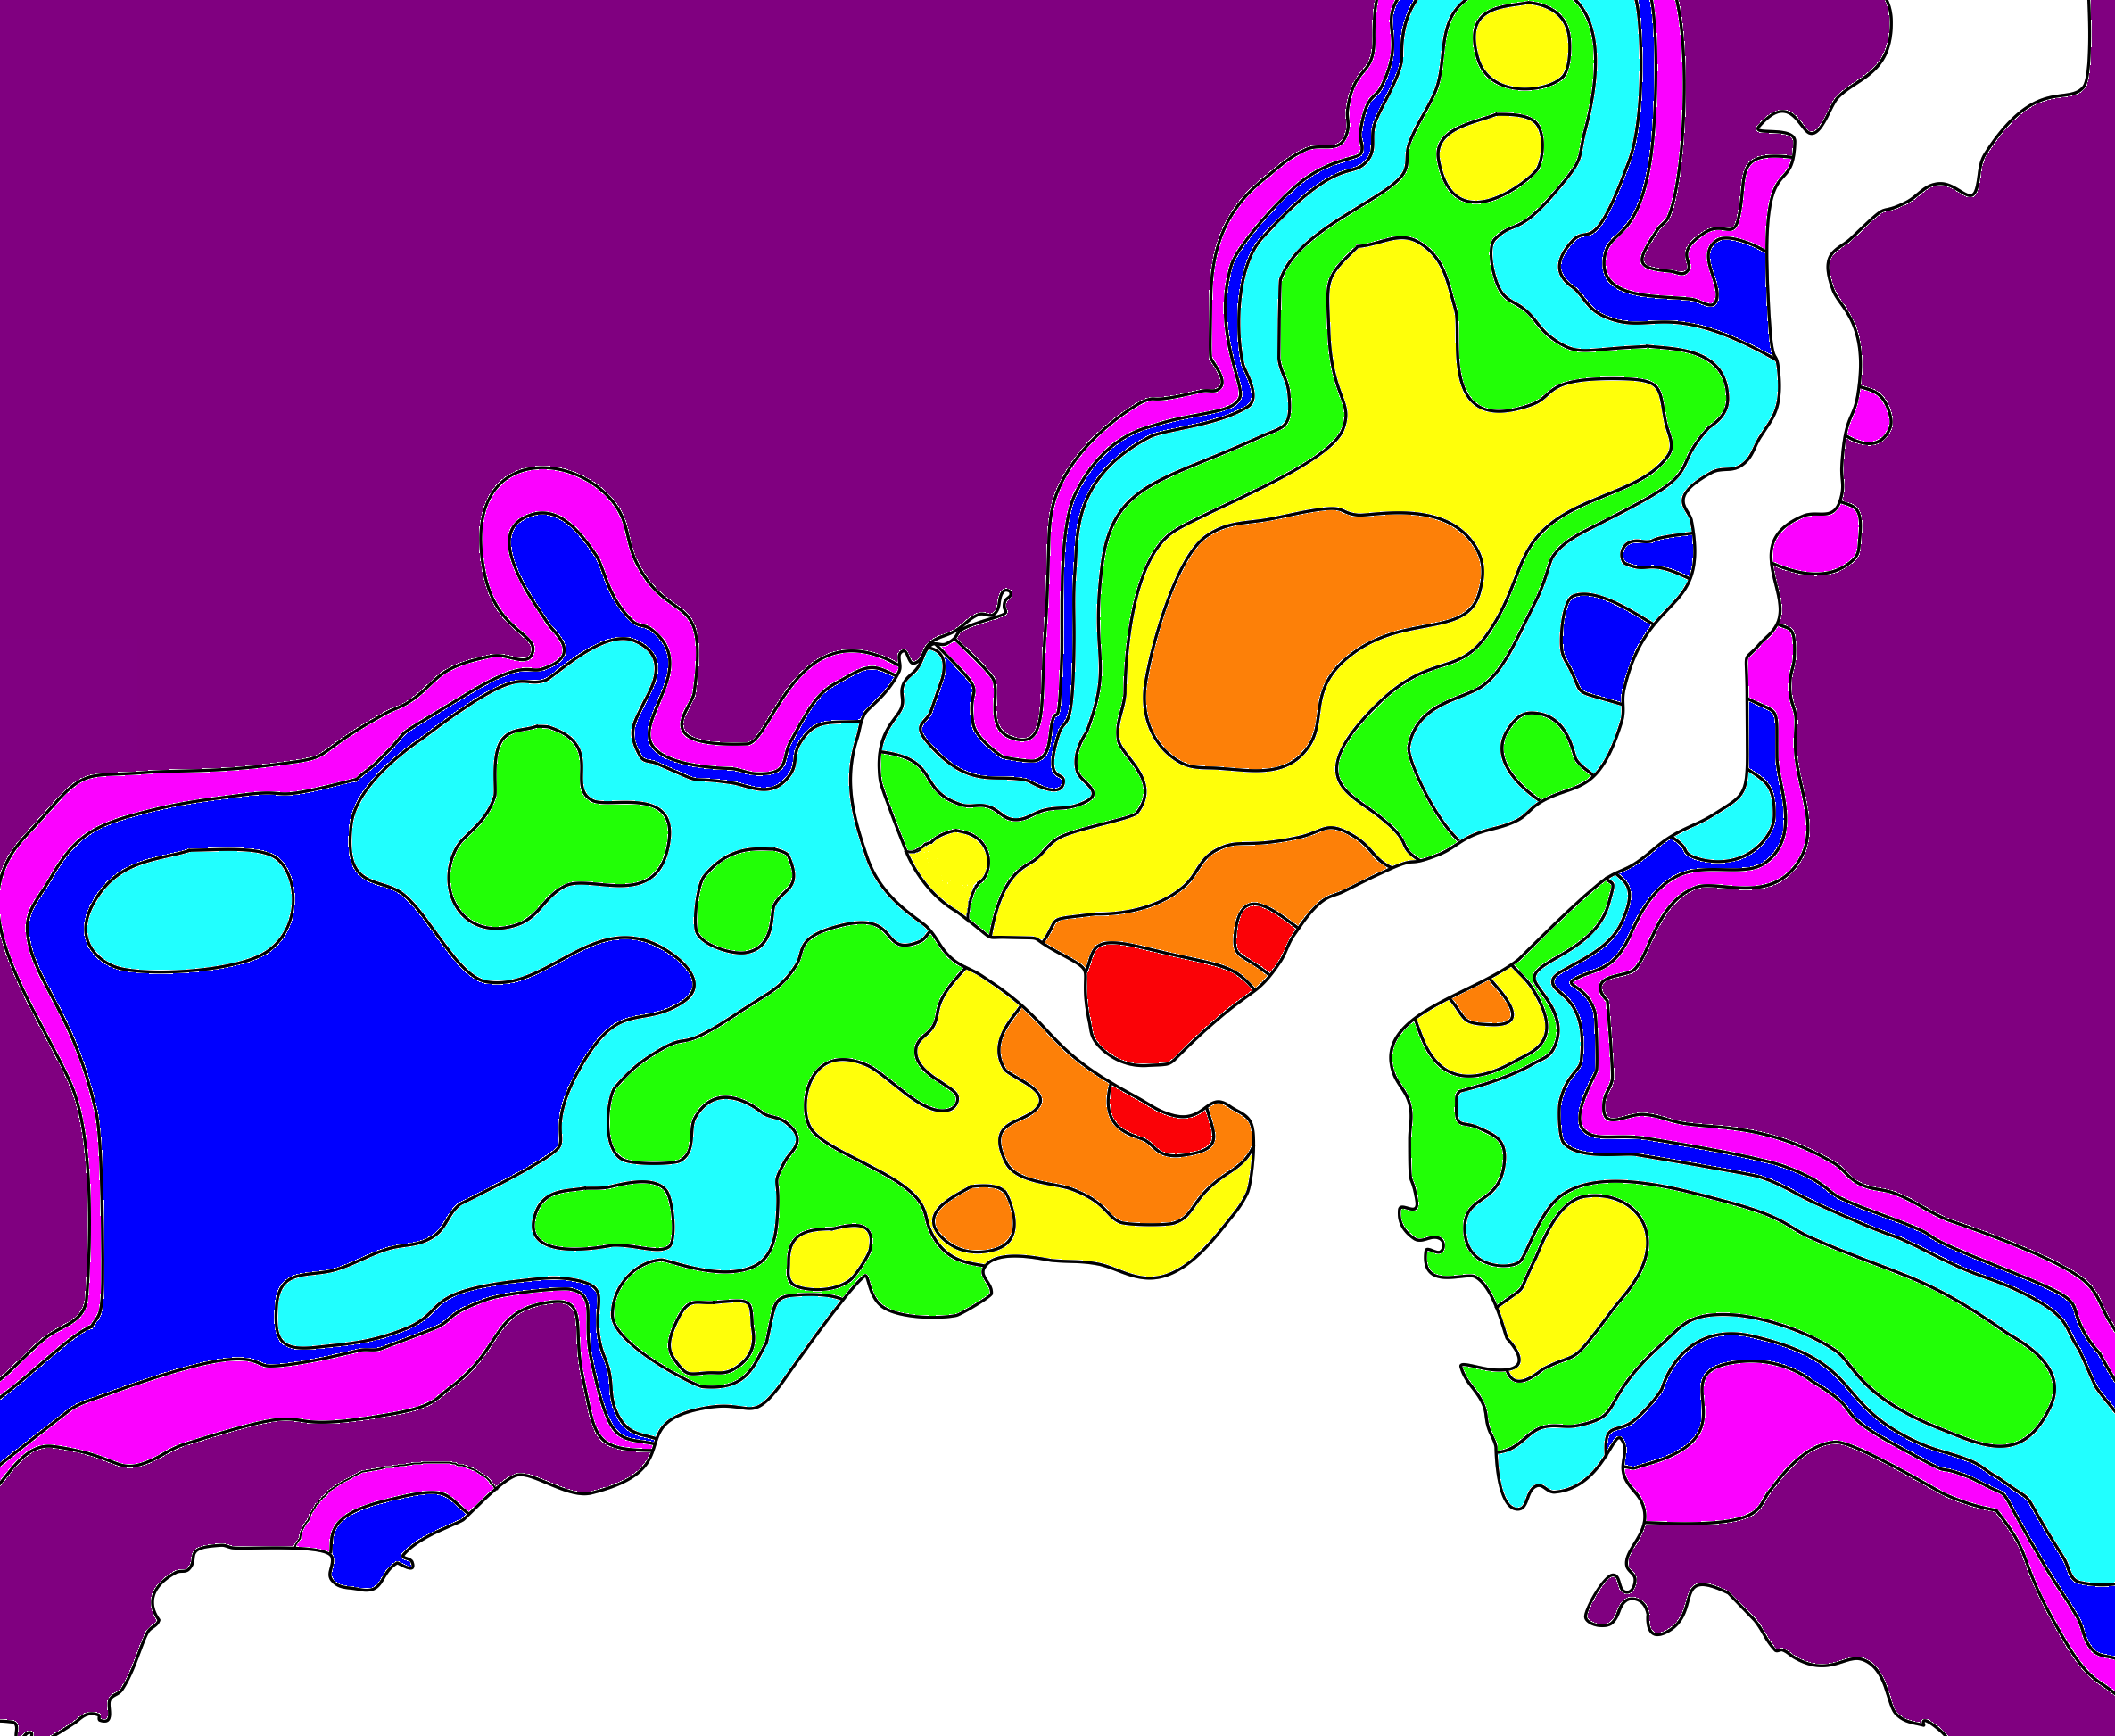
Click here for a full-size version of this week’s map.
This map is the fifth and final map in a five-week series. During this series, we will keep track of both the usual week-to-week scores and your cumulative score over the five-week period.
This map is an isoline map of the a major world city. (Do you need a refresher on what an isoline map is? Visit our “Basics” page for a quick primer.) As with our previous isoline map (Map #9), the map has been generalized from a series of data points and then stylized to appear clearly, so we won’t pretend that it is precisely accurate in every location. In general, however, it should be accurate enough for you to figure out! Your job for this week: figure out what statistic is represented by this isoline map.
Stumped? Check back Tuesday, Wednesday, Thursday, and Friday for hints about where to focus your investigation. The answer will be posted on Monday, January 16. Good luck!
Tuesday’s hint: The city depicted on this map is Istanbul. The white areas are water: the Bosporus runs from northeast to southwest, and the inlet of the Bosporus is the Golden Horn. The land to the east of the Bosporus is in Asia, and the land to the west is in Europe. To the south of the Golden Horn is the oldest part of the city, which was the center of government until the Ottoman Sultan Abdülmecid moved to the newly completed Dolmabahçe Palace on the other side of the Golden Horn in 1856. To the north of the Golden Horn is the section generally regarded as the commercial center of the city. The more you can familiarize yourself with where the different neighborhoods of Istanbul fit on this map, the better you will be able to solve it. One good suggestion is to find the parts that are red on this map and check them out on Google Street View. If you’re stuck, we suggest that you make a list of all the things you see as you spin around in this area.
Wednesday’s hint: There’s an interesting pattern as you move up the Bosporus: on both sides of the strait, there are bits at regular intervals that have higher values than the surrounding area. This pattern can be a bit difficult to visualize, but you can start by looking at the only orange patch on the Asian side. The neighborhood at the center of this orange patch is called Üsküdar. Can you figure out what Üsküdar has in common with the light blue patch and the two magenta patches further up the coast on the Asian side? And what do all these places have in common with the yellow patch to the south?
Thursday’s hint: There’s a distinct trend on this map to have brighter colors on the European side of the Bosporus than on the Asian side. There are really only two places on the Asian side with fairly bright colors. One, mentioned yesterday, is Üsküdar. The other is that yellow place a bit to the south, which is the neighborhood of Kadiköy. One interesting thing about Üsküdar is that it was mentioned in a lot of news stories in October 2013. Can you figure out why?
Friday’s hint: Let’s get back to that list you drew up on Tuesday after reading the first hint and poking around on Google Street View. From a position in Karaköy, you could have seen a bridge across the Golden Horn, a tram line, and a ferry port. If you were to draw this bridge (its name is Galata Bridge) onto our map, you would see that it runs between two of the three red areas (in particular, these areas are Karaköy and Eminönü). What about the third non-contiguous red area, the neighborhood around Fındıklı Park and Mimar Sinan University? How would you get there from Karaköy?
Answer: Click here to see an explanation of the answer to this week’s map question.
Next map: Click here to try out our newest map question.
