
Answer to Map #18
Click here for a full-size version of this week’s map.
Back to this week’s map and hints.
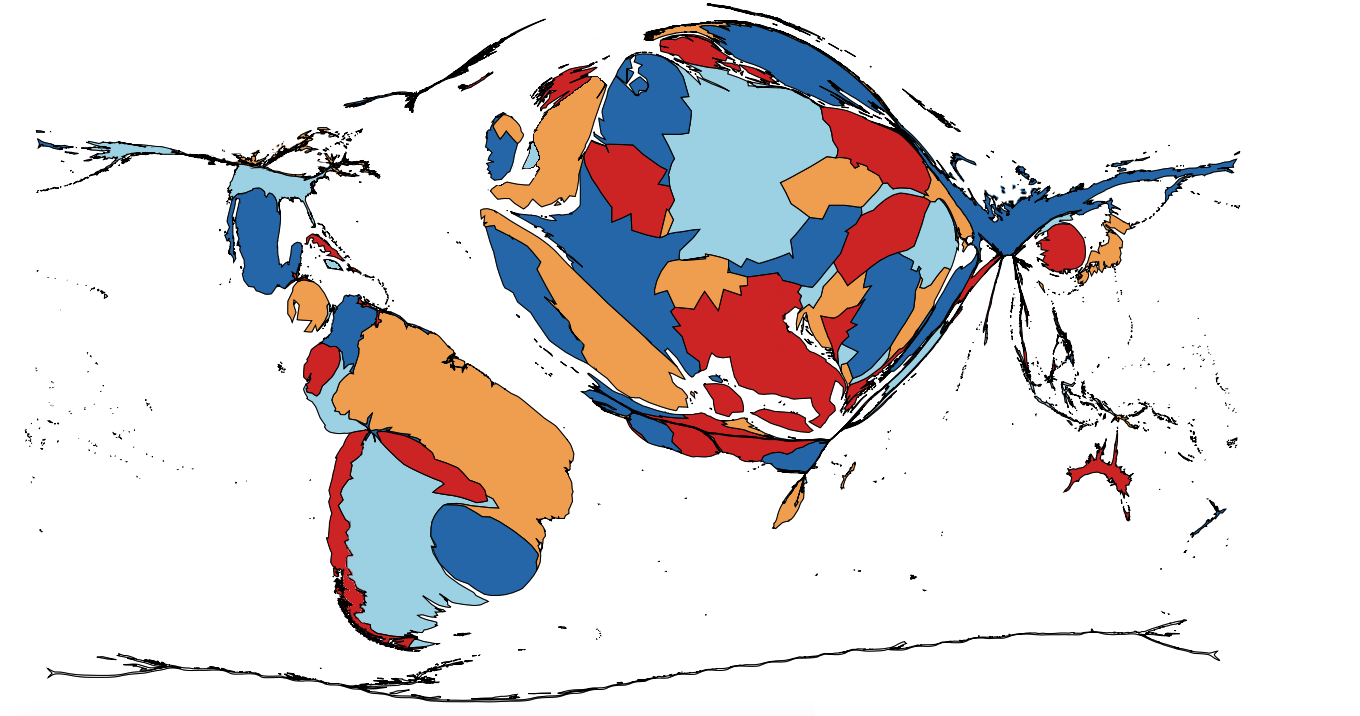
Answer: On this cartogram, the size of each country is proportional to the number of all-time wins it has achieved in the men’s FIFA World Cup Finals. This map counts total wins in all World Cup Finals, dating back to the first tournament in Uruguay in 1930.
The largest country on this cartogram is Brazil, which was won a total of 70 matches (out of 104 played). Brazil is followed, in order, by Germany, Italy, Argentina, and Spain. An all-time table is available here.
In order to make a map that depicts the history of the World Cup dating back to 1930, we had to make several judgment calls on what to do with the records of countries that no longer exist. For countries that no longer exist, we awarded their wins to the successor states that retained the same capital. In other words, Yugoslavia’s history went to Serbia, the Soviet Union’s history went to Russia, and Czechoslovakia’s history went to the Czech Republic. On our map, Germany is the second largest country because it includes wins accumulated by Germany prior to World War II, West Germany between 1945 and 1989, and the reunified Germany since 1990. East Germany won only two games in 1974 (including a win over West Germany), so we simply ignored East Germany for the purposes of this map.
This map makes very clear the extent to which international soccer is dominated by countries from Europe and South America. Only countries from these two continents have ever won a World Cup. Moreover, only twice (or three times, depending whether you count Turkey as “European”) have teams from other continents made the top four (the United States in 1930 and South Korea in 2002). One thing worth bearing in mind, however, is that players from all over the world have competed at a high level in the World Cup. The national teams of many European countries include players who have immigrated to those countries from somewhere else (and many more who are the children of immigrants).
On this cartogram, certain African countries stand out clearly because only a few countries on that continent have had any success in the World Cup. The first African country to take part was Egypt, which played one game in 1934 and lost it. The next time an African country took part was 1970, when Morocco managed two losses and one tie. The first African team to win a game was Tunisia in 1978. Since then, Algeria, Morocco, South Africa, Ghana, Senegal, Cameroon, Nigeria, and Côte d’Ivoire have all experienced some success.
For many of you, the key to solving this week’s cartogram was to notice that Scotland, Wales, and Northern Ireland are depicted separately from England. The tradition of having the Home Nations represented separately in international competition began when England and Scotland competed in the first-ever international soccer match in Glasgow in 1872. Their national teams have remained distinct ever since. Since all four political units of the United Kingdom compete together in the Olympic Games as “Great Britain,” Great Britain usually does not attempt to enter a soccer team in the Olympics. In 2012, when London hosted the Summer Olympics, Great Britain had the right to qualify a team as the host nation. The arrangements for the formation of a British team led to considerable controvery before it was finally agreed to field a men’s team of English and Welsh players, though nobody from Scotland or Northern Ireland participated. The women’s team did include two Scottish players.
For the second week in a row, we had to be strict with answers that were on the right track but not quite correct. If you guessed that this map depicts the total number of appearances of each country in the FIFA World Cup—or any other answer related to the performance of a team that was not “total number of wins”—then we gave you half credit. Tuesday’s hint was intended to help clarify this situation. The countries we pointed out in that hint, such as Togo and El Salvador, were not selected at random; instead, those are all countries that have played in a World Cup Final without managing to win a game. If this were a map of World Cup appearances, then there would be a lot more countries on it, including many in Africa and several in Central America and the Caribbean.
Next map: Click here to try out our newest map question.
