
Map #14c: November 14, 2016
Geography Awareness Week 2016
Difficulty Level: 7
Click here for a full-size version of this week’s map.
In celebration of Geography Awareness Week, we have three maps this week. Please submit solutions for the three maps separately, taking care to use the same name and email address. Each of the three maps will have its own hints as usual, and a perfect score for the week will be worth a total of 15 points. Make sure to check out Map #14a and Map #14b as well as this map.
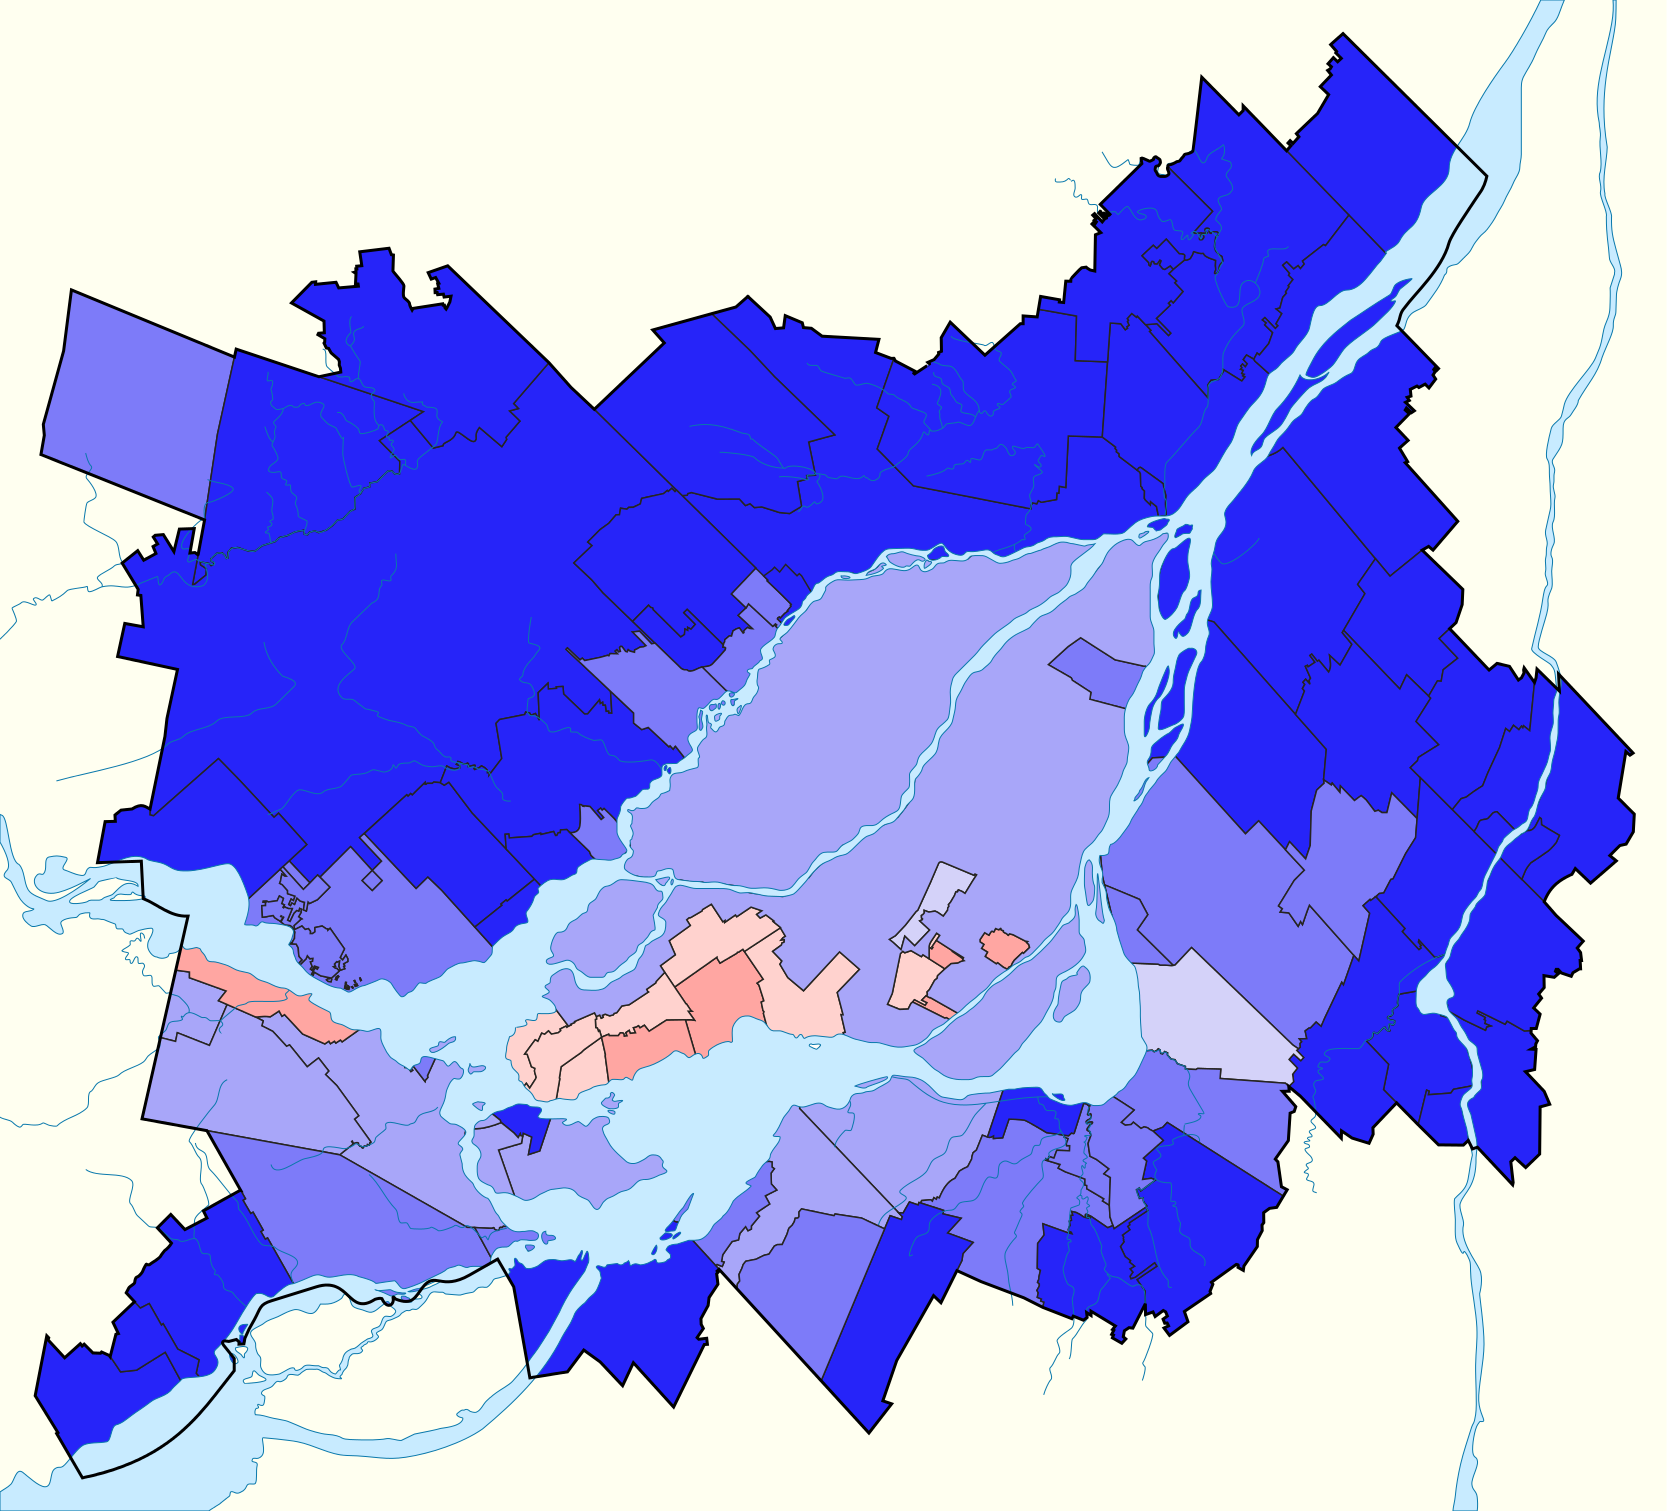
This map is a choropleth of the metropolitan area of a major world city. (Do you need a refresher on what a choropleth is? Visit our “Basics” page for a quick primer.) On this map, each section of the city is shaded in accordance with a particular statistic. As with Map #8 and Map #10, this map is a choropleth with two colors that represent divergent ends of a spectrum. Your job for this week: figure out what city this is and what statistic is represented by this choropleth.
Stumped? Check back Tuesday, Wednesday, Thursday, and Friday for hints about where to focus your investigation. The answer will be posted on Monday, November 21. Good luck!
Tuesday’s hint: The most important step here is to figure out which city this is. It’s a city in the Western Hemisphere, but we aren’t yet ready to tell you which one it is. You’ll note that the center of the city is on several islands (this map shows the whole metropolitan area, not just the city limits) in the middle of a large river. Your first step should be looking for cities in the Western Hemisphere that are on islands!
Wednesday’s hint: One interesting feature of this map is the fact that the center of the city—that is, the part on the central islands—is much lighter than the suburbs on either bank of the river. In general, the farther you go away from the center of the city, the bluer the map is. The basic explanation for this trend is that cities are often cosmopolitan areas that bring together diverse groups of people.
Thursday’s hint: The city depicted by this map is Montreal. The city proper, home to about 1.6 million people, is the light blue area on the main central island. The island of Montreal is also home to some suburbs that are not part of the city of Montreal, many of which are colored light red on this map. You may be able to solve this map if you look up some of these cities and try to figure out what makes them distinct from the rest of the urban area.
Friday’s hint: Among the reddish areas on Montreal island are the cities of Beaconsfield, Kirkland, and Westmount. There is an important hint in the names of these cities. You might wish to contrast these names with the three darkest blue areas on the map: Verchères, L’Épiphanie, and Lavaltrie. How are the names in the first group different from the names in the second group?
Answer: Click here to see an explanation of the answer to this week’s map question.
Next map: Click here to try out our newest map question.
