
Answer to Map #9
Click here for a full-size version of this week’s map.
Back to this week’s map and hints.
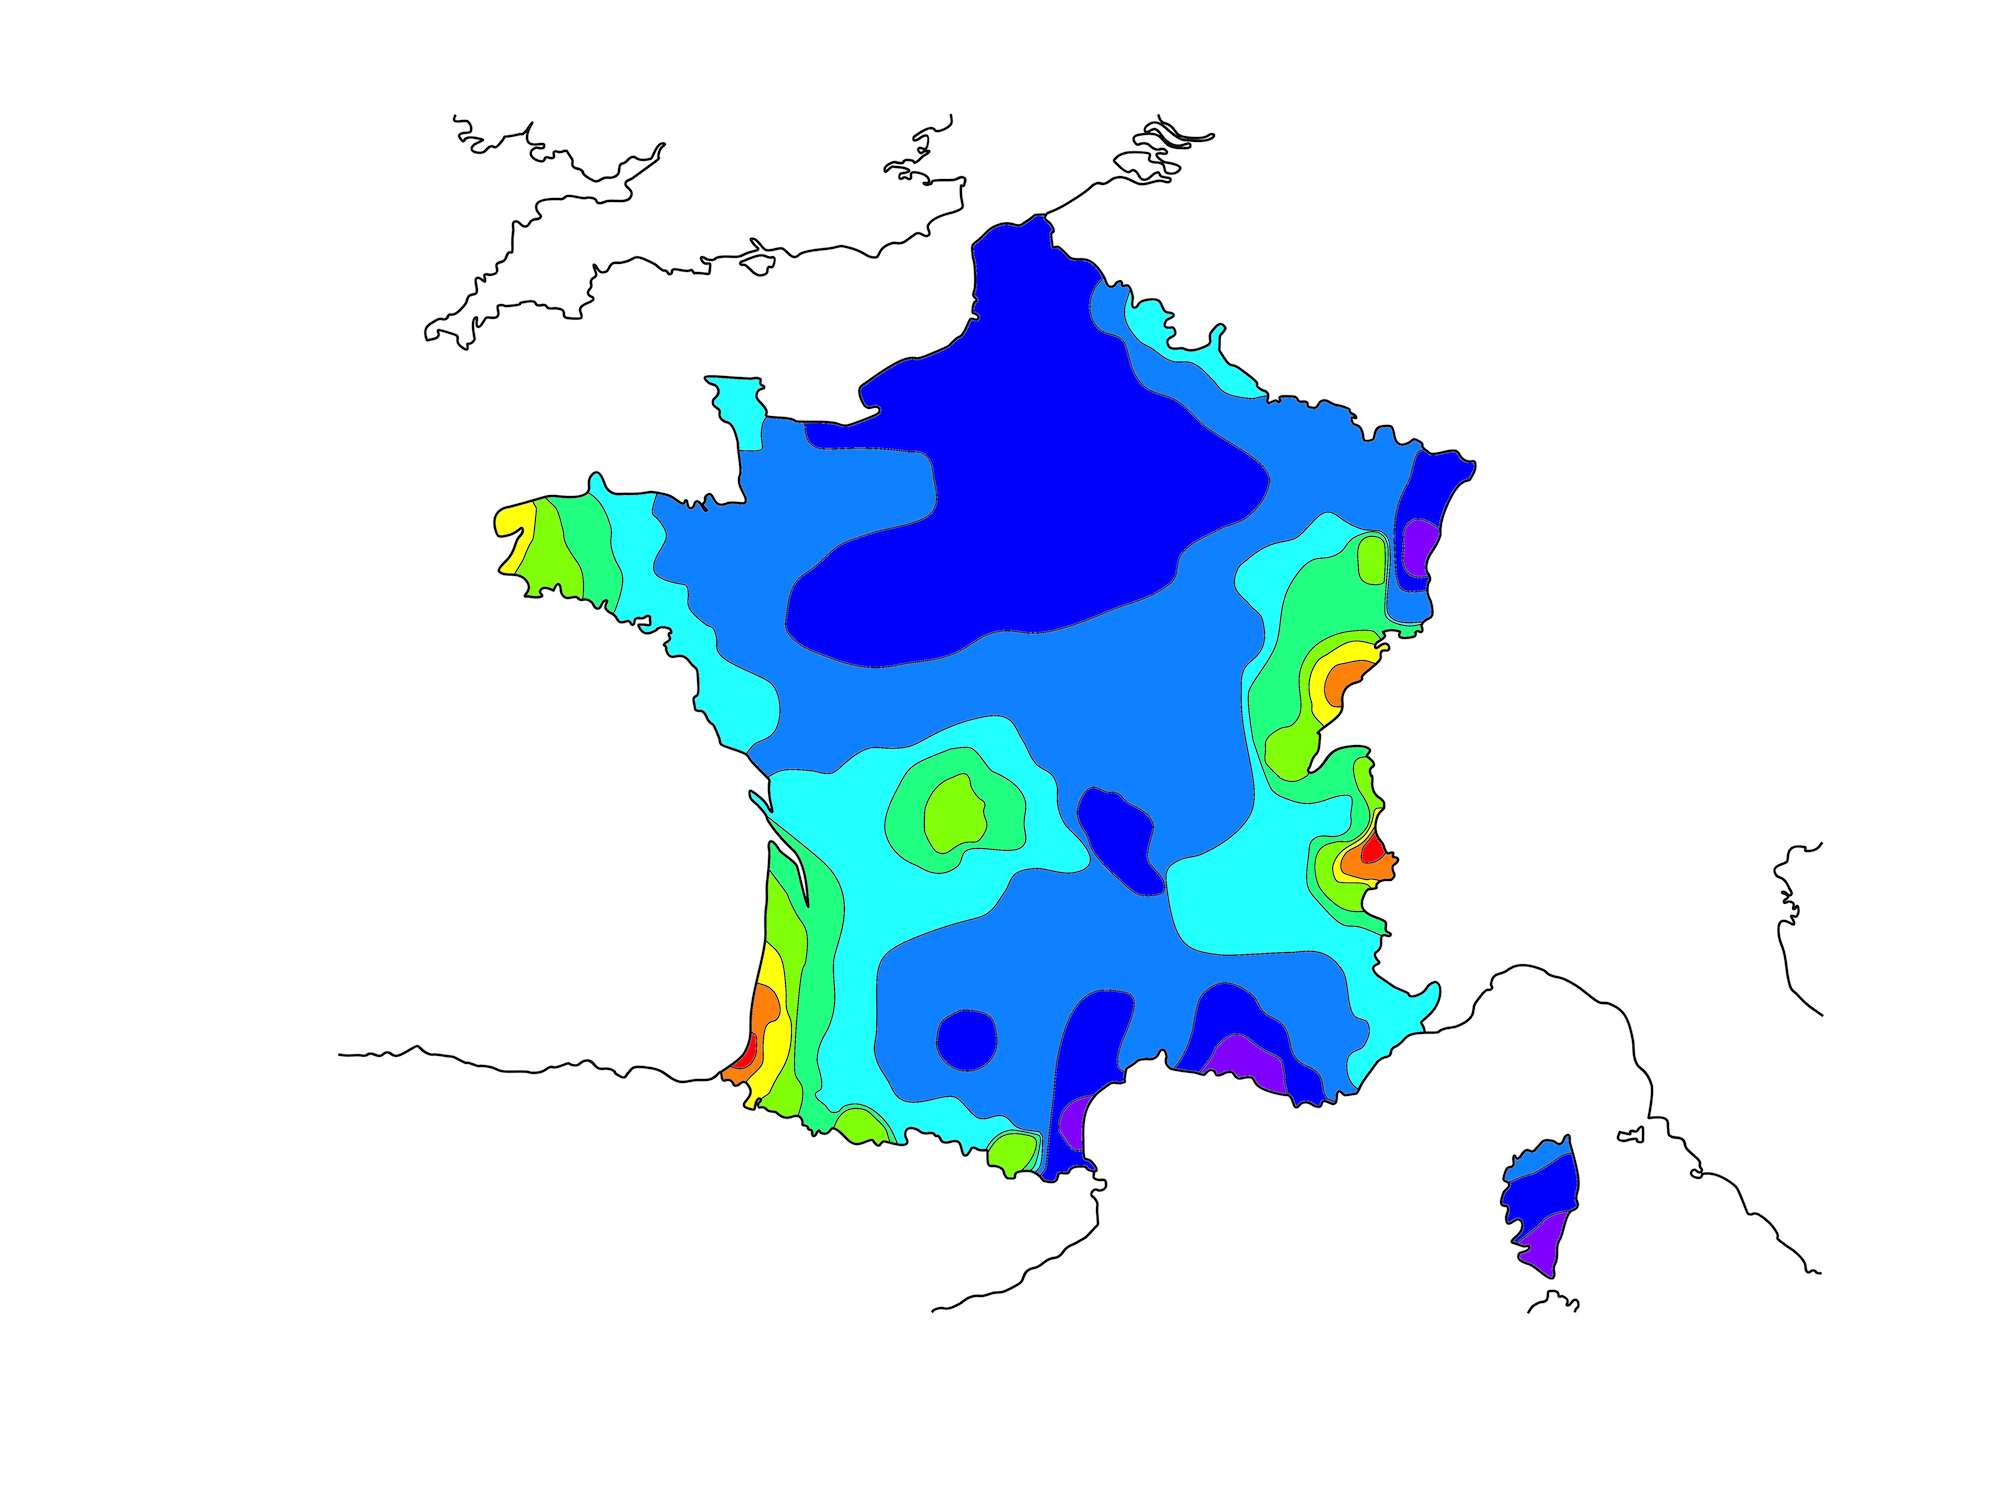
Answer: This week’s isoline map depicts the average annual precipitation across France. The isolines on this map are called isohyets. Each isohyet connects places that receive equal average annual precipitation.
On this map, each band of color indicates places that fall into a range of 100 millimeters of precipitation. Red areas on this map, such as Chamonix and Biarritz, receive more than 1,300 millimeters of precipitation each year. Purple areas, such as Marseilles and the southern tip of Corsica, receive between 400 and 500 millimeters of precipitation each year.
The data used to make this map was taken from Climate-Data.org, a website that collects a huge amount of information about climates worldwide. We mapped precipitation data for nearly 500 French cities and towns, then used that information to draw isohyets. As such, this map is not as precise as it would be if we had used, for example, 1,000 data points to draw our isohyets—but it should be good enough for you to figure out!
One hint this week drew your attention to the fact that France’s overseas departments would be difficult to include on this map. French Guiana, in particular, has tropical rainforest and tropical monsoon climates that receive huge amounts of rainfall each year. Cayenne, the capital of French Guiana, receives an average of 3,025 millimeters of precipitation each year, more than double that of either Chamonix or Biarritz. If we had wanted to include French Guiana on our map, we would have had to have chosen a significantly different scale.
In the temperate zone of the Northern Hemisphere, the prevailing winds come from the west (they are called “Westerlies”). When weather systems capable of producing precipitation form over the ocean, they are pushed eastward by these winds onto land. As a result, places on the west coast tend to receive a significant amount of rainfall. The same principles that hold true for Seattle (a city on the west coast of the United States) also hold true for cities on the west coast of France, such as Biarritz, Bordeaux, and Brest.
The other places that tend to receive significant amounts of precipitation are those places just to the west of mountain ranges. Since most weather systems that cause precipitation come from the west, they dump rain and snow on the west side of mountain ranges when they cannot pass beyond those ranges. On the east side of the mountains, you often find what is called a “rainshadow effect,” meaning that those places have significantly less rain. On this week’s map, you may have noticed that the Vosges Mountains cause a rainshadow that keeps Alsace (to the east of the mountains) much drier than Lorraine (to the west of the mountains). Noticing this difference between Alsace and Lorraine helped many people who submitted solutions this week to come up with the correct answer.
If you searched online for images of precipitation maps of France, you may have found some maps that differ slightly from our map. One reason for this is that there are a lot of maps online that show precipitation from only one year. One example might be this map from the European Environment Agency, which shows precipitation patterns from only the year 2008. This map is similar to ours, but not exactly the same because weather differs from year to year. It might be a useful lesson for teachers to ask their students to compare the 2008 map with our average map.
Next map: Click here to try out our newest map question.
