
Map #9: October 10, 2016
Difficulty Level: 8
Click here for a full-size version of this week’s map.
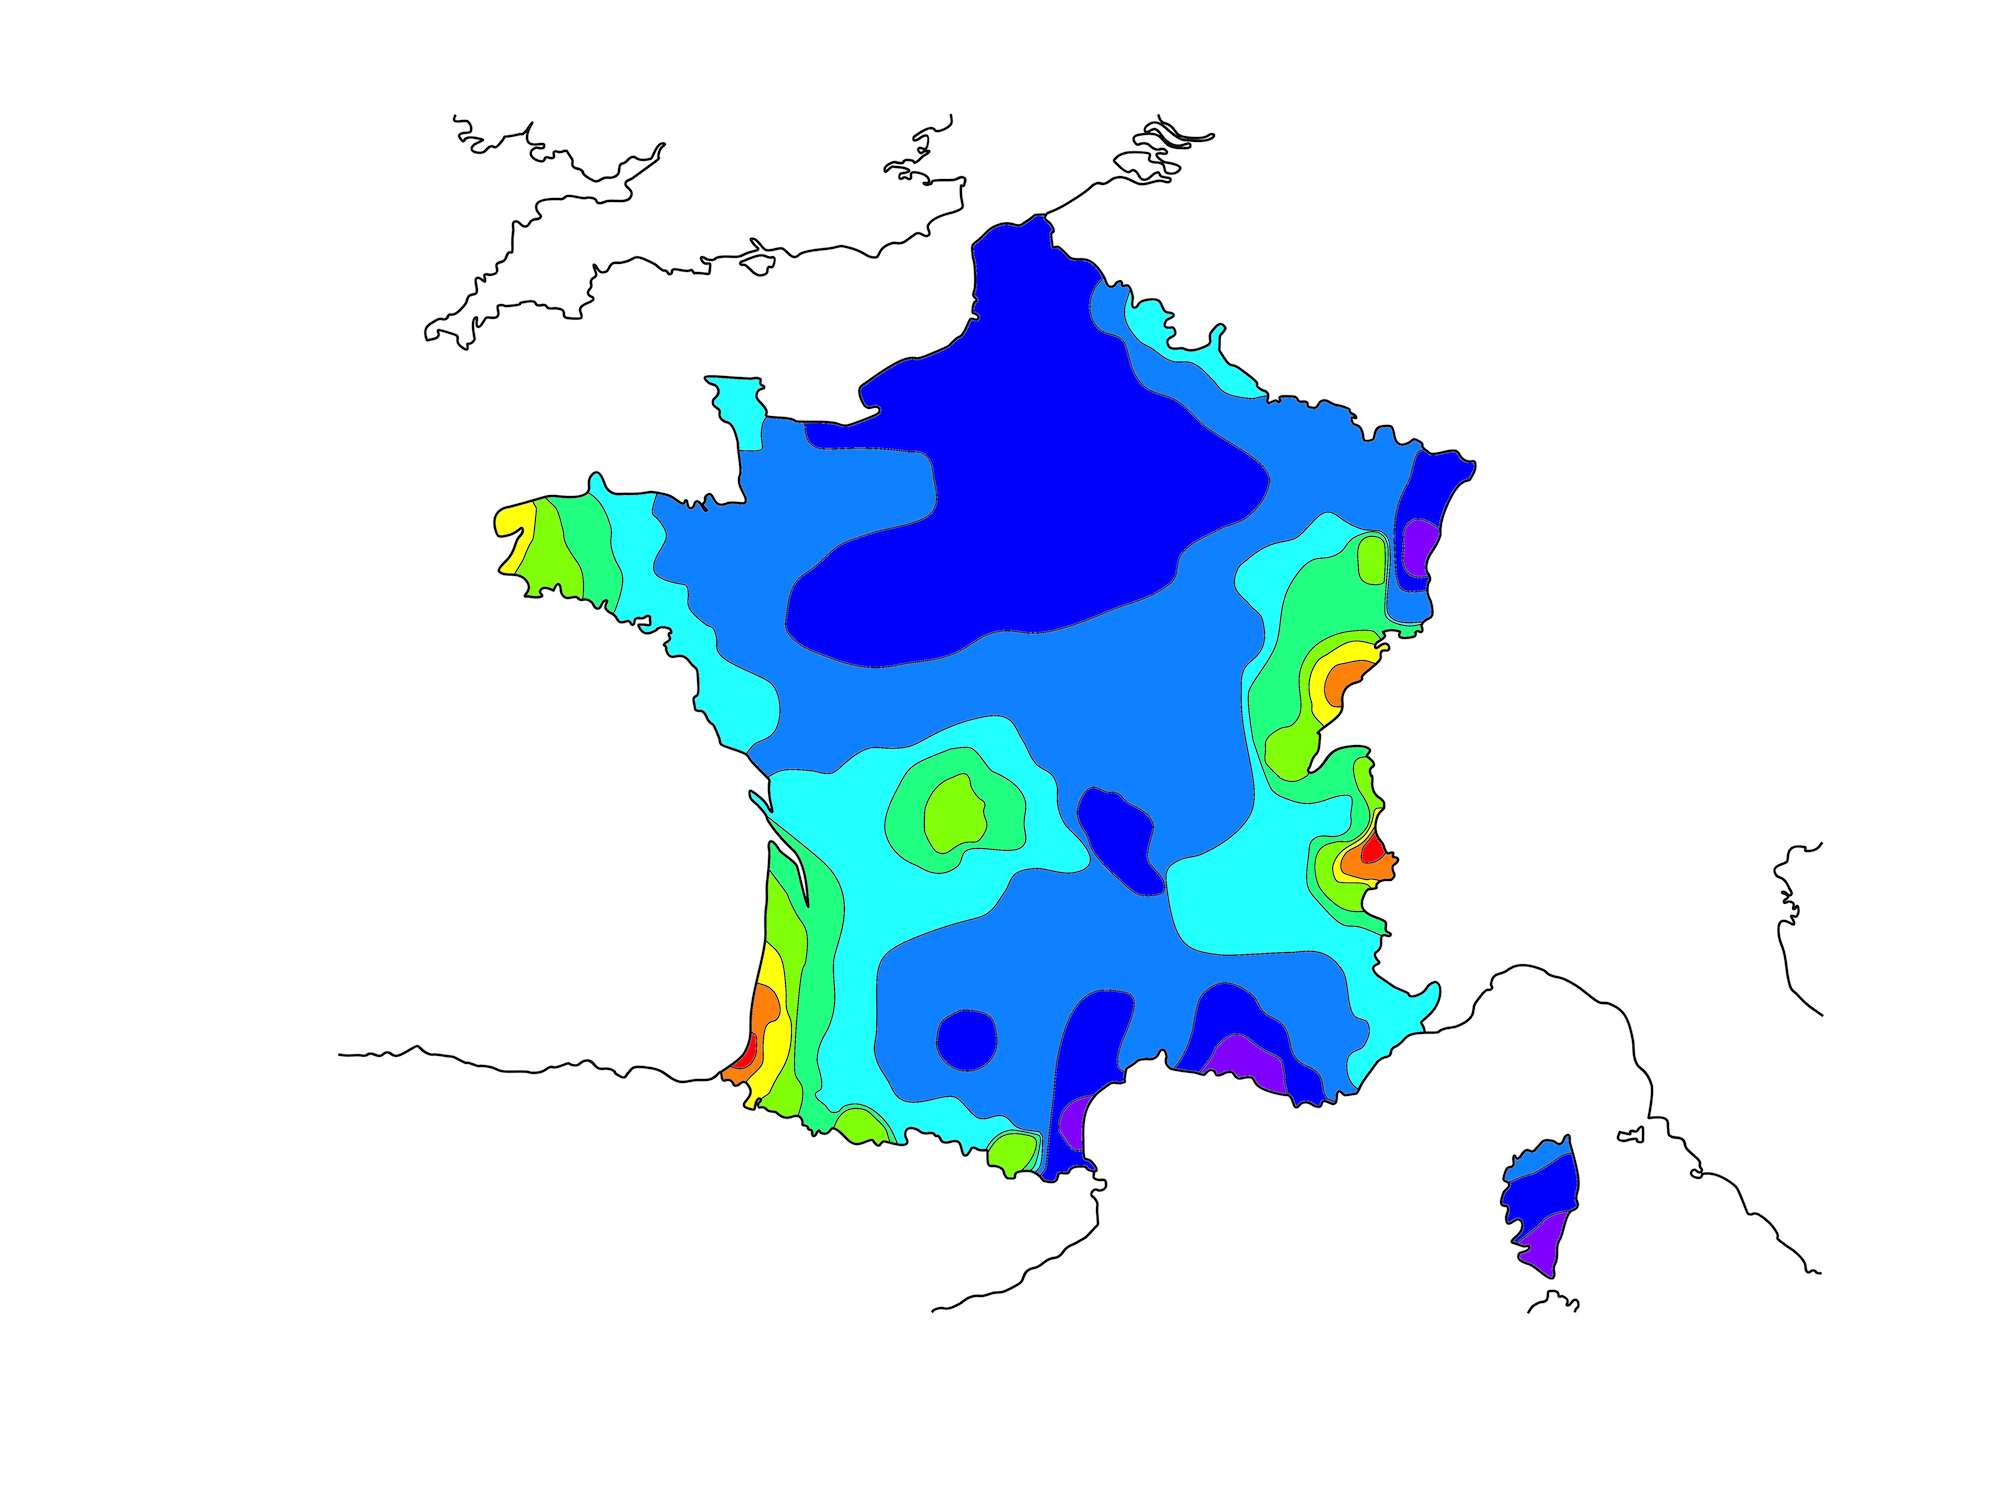
This map is an isoline map of France. Technically, we should be precise and say that it’s just a map of mainland France and Corsica—we haven’t chosen to inlude any of France’s overseas departments, such as French Guiana or Guadeloupe. (Do you need a refresher on what an isoline map is? Visit our “Basics” page for a quick primer.) On this map, the thin black lines are isolines connecting points that are equal in a particular statistic. To help make things clearer, we have colored the areas inside those lines. Red areas have the most of this week’s mystery statistic, while purple areas have the least. Your job for this week: figure out what statistic is represented by this isoline map.
Stumped? Check back Tuesday, Wednesday, Thursday, and Friday for hints about where to focus your investigation. The answer will be posted on Monday, October 17. Good luck!
General warning: Since this is our first isoline map, you may wish to be especially careful when you submit your answer. There are two areas on this map that are colored bright red. If your answer doesn’t clearly explain why both of those areas are red, then it probably isn’t correct!
Tuesday’s hint: Let’s start by looking at the parts of this map which are most red. If you have checked this map against a regular map of France, you will have noticed that these two regions contain the cities of Chamonix and Biarritz. Chamonix, a famous ski town near Mont Blanc in the Alps, hosted the first Winter Olympics in 1924. Biarritz is a resort town that attracts many tourists to lounge on its beaches, go surfing, and play in its casinos. Both Chamonix and Biarritz are important tourist destinations, but that fact isn’t relevant to solving this week’s map—at least, not directly. Instead, your first task should be to figure out what else these two cities in very, very different parts of the country have in common.
Wednesday’s hint: We mentioned when we first posted this map that it’s only a map of mainland France and Corsica, not any of France’s overseas departments. What would have happened if we had included them? The main thing is that we would have needed either to change our scale entirely or to invent many new shades of red. Cayenne, the capital of French Guiana, would require fully eighteen isolines beyond the level of Biarritz and Chamonix.
Thursday’s hint: One of the most interesting parts of this map is the light green oval in Lorraine and the purple oval just to the east of it in Alsace. What is intriguing about this part of the map with five parallel isolines in a narrow band, indicating a dramatic change in values over a short distance. You need to determine why the values are so much higher in Lorraine than in Alsace. First, see if you can figure out what physical feature forms the boundary between Lorraine and Alsace. (Fun but irrelevant historical fact: from the end of the Franco-Prussian War in 1871 until the end of World War I in 1918, this same feature was the boundary between France and Germany) Second, imagine if that feature had been drawn onto this map. Would that help make it clearer?
Thursday’s warning: Quite a few people have been submitting the same incorrect solution: that the red colors on the map indicate areas where fewer people speak standard French as a native language. It is true that the area around Biarritz, which is one of the red areas on our map, is home to many people who speak Basque. And it’s true that Brittany, which has some yellow and green sections, is the home of the Breton language. But in the twenty-first century, the second-most commonly spoken language at home in France is Arabic, not Basque or Breton. And the places in France that are home to the most immigrants are big cities like Paris and Marseilles, not Chamonix. Most important, though, is that, if we were going to make a map of languages, we almost certainly wouldn’t use an isoline map to do it because one wouldn’t expect the datapoints to be so evenly distributed—a choropleth would make much more sense. When you submit a solution, please take a moment to consider whether your proposed solution would be best mapped with the kind of map we’re using this week.
Friday’s hint: Yesterday’s hint referred to the Vosges Mountains, which form the border between Lorraine and Alsace. This map shows that there is more of our mystery statistic to the west of the Vosges and less to the east of it. You may also have noticed that several of the other areas toward the red (high) end of the spectrum are near mountains, including two such regions just on the western slopes of the Alps. It is significant not only that these areas are near mountain ranges, but also specifically that they are on the western slopes of those mountain ranges.
Answer: Click here to see an explanation of the answer to this week’s map question.
Next map: Click here to try out our newest map question.
